


Note this forecast page is not the most recent forecast available.
View the most current forecast report
Researcher Analyzes Arizona COVID-19 Spread Models for Decision-Makers
The following information regarding the spread of COVID-19 in Arizona was prepared by Joe Gerald, MD, PhD, a researcher at the Mel and Enid Zuckerman College of Public Health (MEZCOPH) at the University of Arizona. This information has also been reviewed by other MEZCOPH faculty.
This data were obtained from the Arizona Department of Health Services COVID-19 webpage and reflect conditions in Arizona as of December 18, 2020.
This information is intended to help guide our response to the outbreak. It is not intended to predict how this pandemic will evolve. Rather, this model extrapolates what might occur if current conditions remain unchanged. As regional authorities and healthcare providers respond, their actions are expected to mitigate the worst consequences of this pandemic.

COVID-19 Disease Outbreak Forecast
Arizona State and Pima County
Updated December 18, 2020
Disclaimer: This information represents my personal views and not those of The University of Arizona, the Zuckerman College of Public Health, or any other government entity. Any opinions, forecasts, or recommendations should be considered in conjunction with other corroborating and conflicting data. Updates can be accessed at https://publichealth.arizona.edu/news/2020/covid-19-forecast-model.
**NOTICE** Arizona is experiencing a public health crisis where access to critical care services is limited due to shortages of space, personnel, and critical supplies. If not addressed within the next 1 - 2 weeks, this crisis will evolve into a humanitarian crisis leading to hundreds of preventable deaths. At this point, only shelter-in-place restrictions are certain to quickly and sufficiently curtail viral transmission. Because such restrictions impose substantial economic hardships, these measures should be augmented by state expansion of programs to provide direct economic assistance, reduce food insecurity, prevent foreclosure and evictions, and protect access to health services.
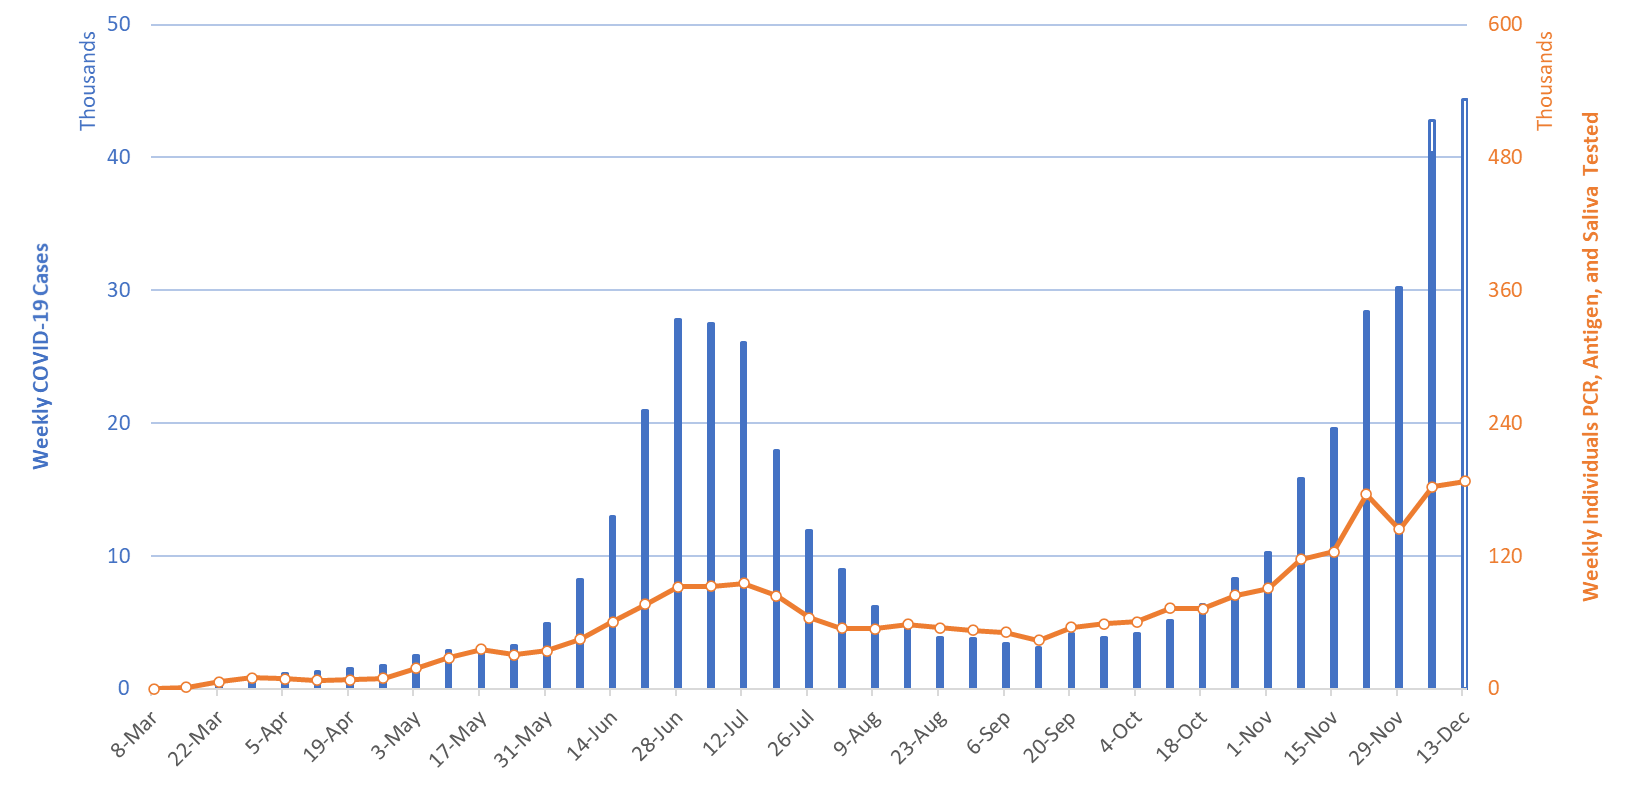
For the week ending December 13th, at least 44390 new Covid-19 cases were diagnosed in Arizona (Figure 1). This is a 10% increase from last week’s initial tally of 40356 cases and a new state record. Last week’s tally was upwardly revised by 2410 cases this week, a 6% increase.
While test capacity is rising slightly, test positivity continues to increase, setting a new record, 26%. In an unfortunate event, approximately 10,000 patients were told that their PCR test could not be completed owing to a laboratory backlog. It is unclear how this may have affected this week’s case count. If it weren’t for typical backlog and the newly missing tests, Arizona might have recorded 50000 new cases this past week instead of the 44390.
|
Figure 1. Newly Diagnosed Covid-19 Cases in Arizona and Number of Individuals Undergoing Covid-19 Diagnostic Testing March 1 through December 13. |
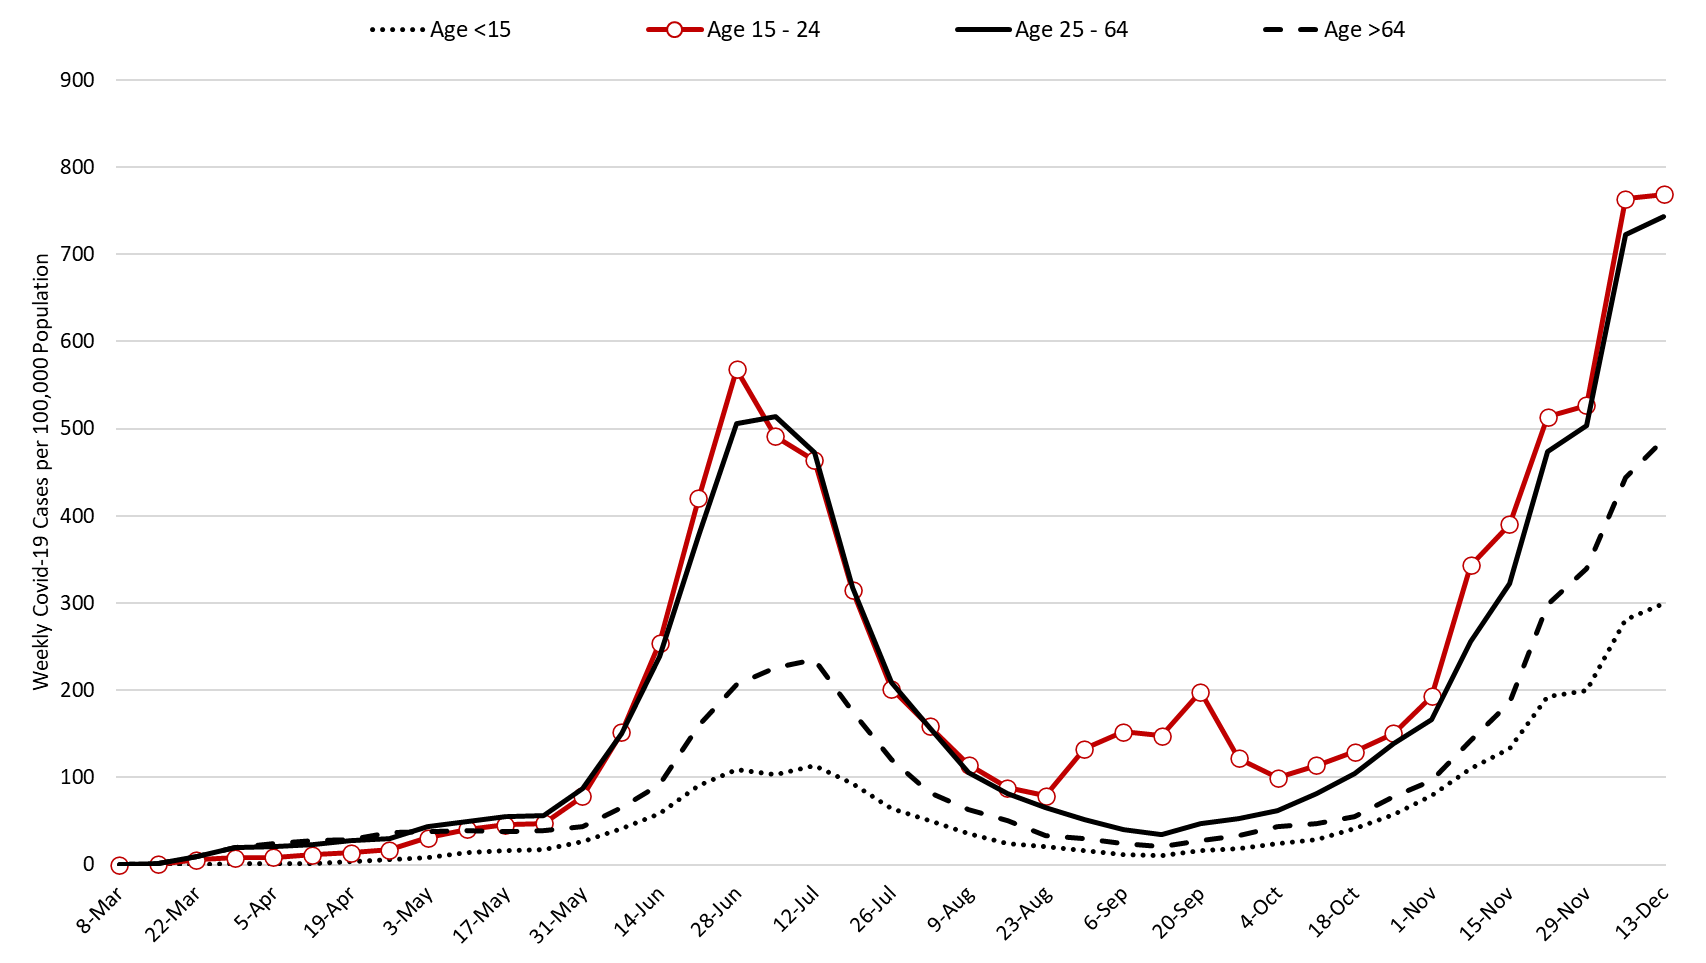
The outbreak remains broadly entrenched including among those >64 years of age who are at highest risk of hospitalization, ICU admission, and mortality (Figure 2). For this reason, we can expect hospitals to continue to experience increasing occupancy at least through New Year’s Day.
Note: Data for this report was updated Friday, December 18 allowing 4 working days to adjudicate weekend cases and keep week-over-week backfill <10%. This allows more interpretable comparisons and graphics. All comparisons are week-over-week changes. Future updates will continue to be released on weekends.
|
Figure 2. Newly Diagnosed Covid-19 Cases in Arizona by Age Group March 1 through December 13. |
Test positivity among those undergoing traditional PCR testing set a record this past week at 26.3% (Figure 3). Increasing test positivity indicates that viral transmission is increasing despite the uncertainty surrounding the precise case count. I am withholding the test positivity for antigen tests being conducted by the University of Arizona and by some long-term care facilities and retail clinics for quality reasons. Test positivity for saliva testing being conducted by Arizona State University for students and other groups was 16.8% this week.

|
Figure 3. Weekly Number Patients Traditional PCR Testing and Percent Positivity March 1 – December 13. |
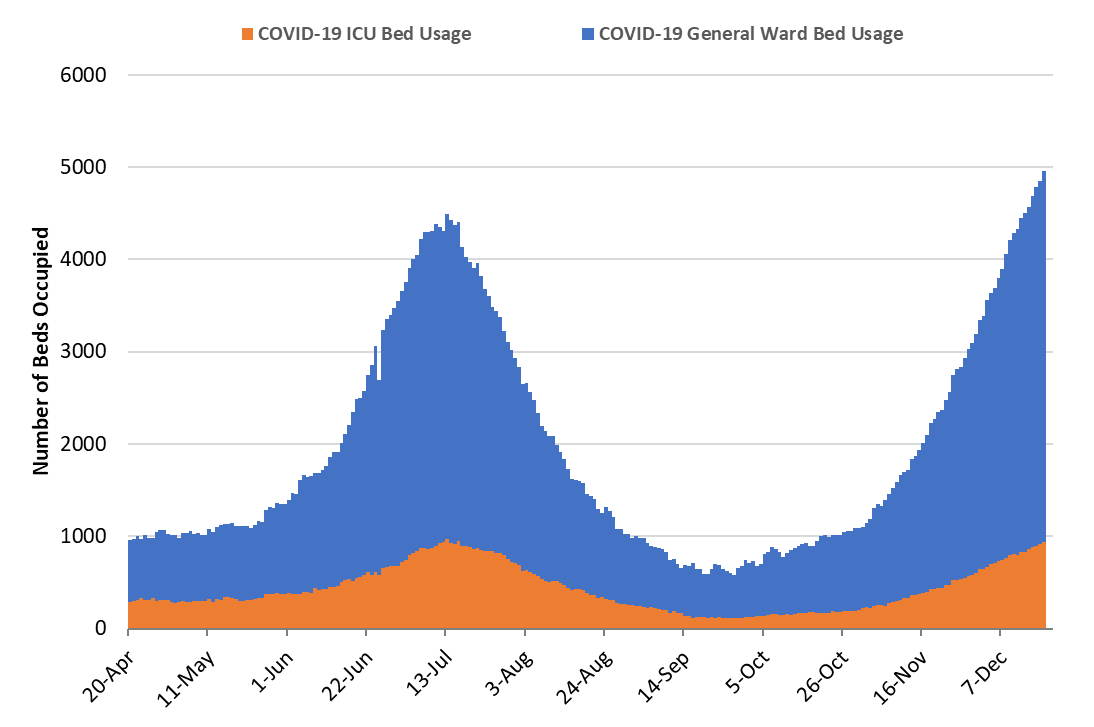
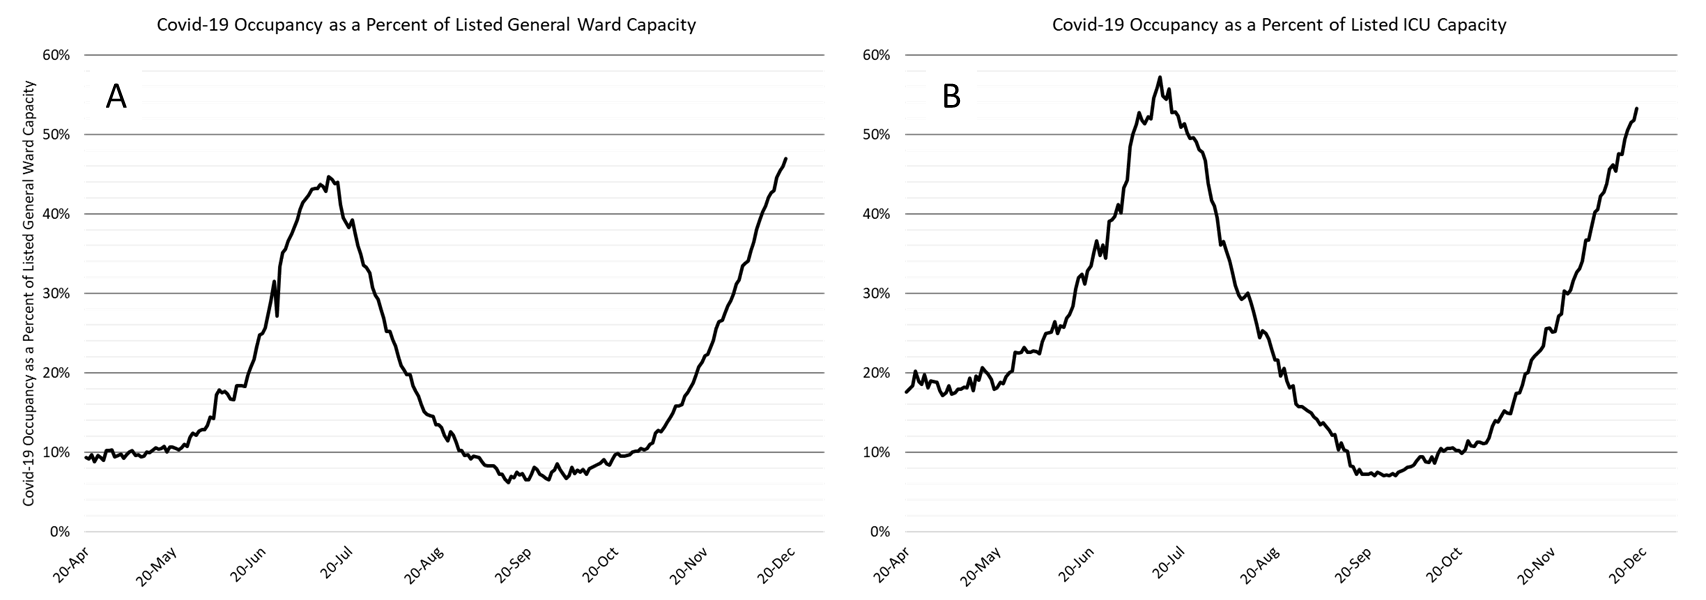
As of December 18th, 4014 (47%) of Arizona’s 8548 general ward beds were occupied by Covid-19 patients, a 14% increase from last week’s 3534 occupied beds (Figure 4 and Figure 5 Panel A). Another 666 (8%) beds remained available for use. The number of available beds is lower than last week’s 768 beds.
At 4014 occupied ward beds, Arizona has exceeded its July peak of 3517 beds. At 47% occupancy, Arizona has also exceeded its July 13th occupancy peak of 45%.
|
Figure 4. Arizona Daily Covid-19 General Ward and ICU Census April 20 – December 18. |
As of December 18th, 939 (53%) of Arizona’s 1763 ICU beds were occupied with Covid-19 patients, a 18% increase from last week’s count of 799 patients (Figure 4 and Figure 5 Panel B). An additional 136 (8%) ICU beds remain available. This is lower than last week’s 163 beds. Max Covid-19 ICU occupancy was 970 (57%) beds on July 13th. These records should fall in the coming week.
|
Figure 5. Covid-19 Occupancy as a Percent of Listed General Ward (A, left) and ICU (B, right) Capacity in Arizona April 20 – December 18. |
Arizona hospitals’ safety margin continues to erode in both the ward and ICU (Figure 6). Most hospitals have now cancelled scheduled procedures to ensure adequate capacity for patients with Covid-19 care. We are now undergoing the great “displacement” such that hospital services are now being rationed so that patients with severe Covid-19 illness are displacing others who have slightly less severe non-Covid medical conditions. As Covid-19 illness continues to increase, delaying others’ care will become ever more difficult. At some point, hospitals will have to expand their physical capacity. Make no mistake, the Covid-19 crisis is now placing a greater share of Arizonans’ at-risk, not just those unfortunate enough to contract Covid-19.
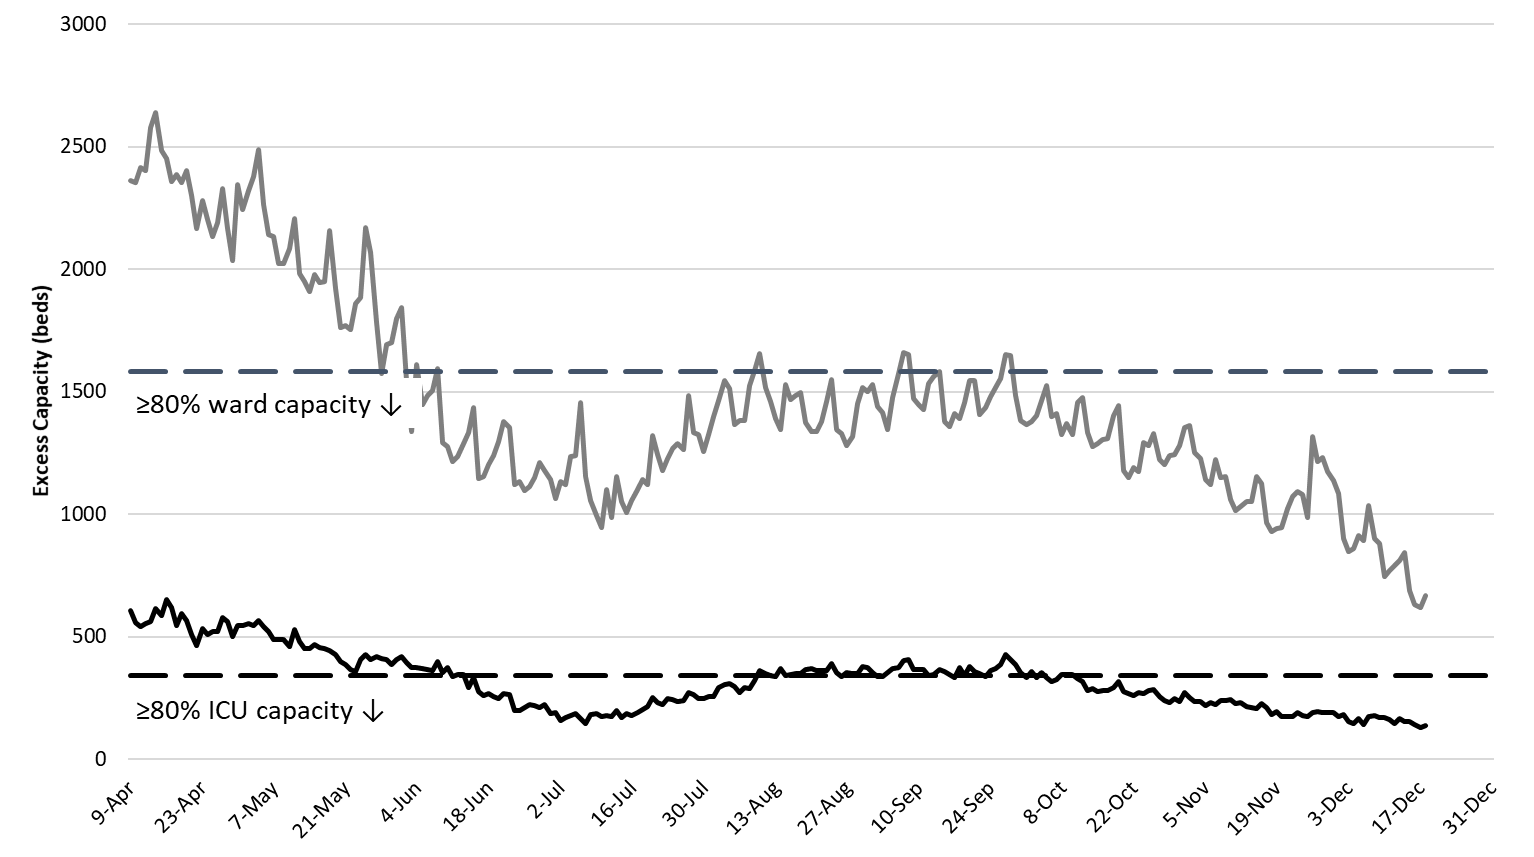
|
Figure 6. Observed Excess Non-Surge General Ward and ICU Capacity April 20 – December 18. |
With 617 deaths, the week ending July 19th remains Arizona’s deadliest week (Figure 7). Weekly Covid-19 mortality reached a nadir of 46 deaths the week ending October 4th. Because cases have been increasing, deaths are also increasing. Sharper rises are expected over the coming weeks as deaths lag new cases by 14-days and are often only made known weeks later. By Christmas, Arizona will be experiencing >500 deaths per week. However, this toll will not be apparent until mid-January once all deaths are accounted for. As a rule of thumb, multiply the number of weekly deaths by 1.5% (approximate case fatality rate) to estimate the number of expected deaths in 2 – 3 weeks time.
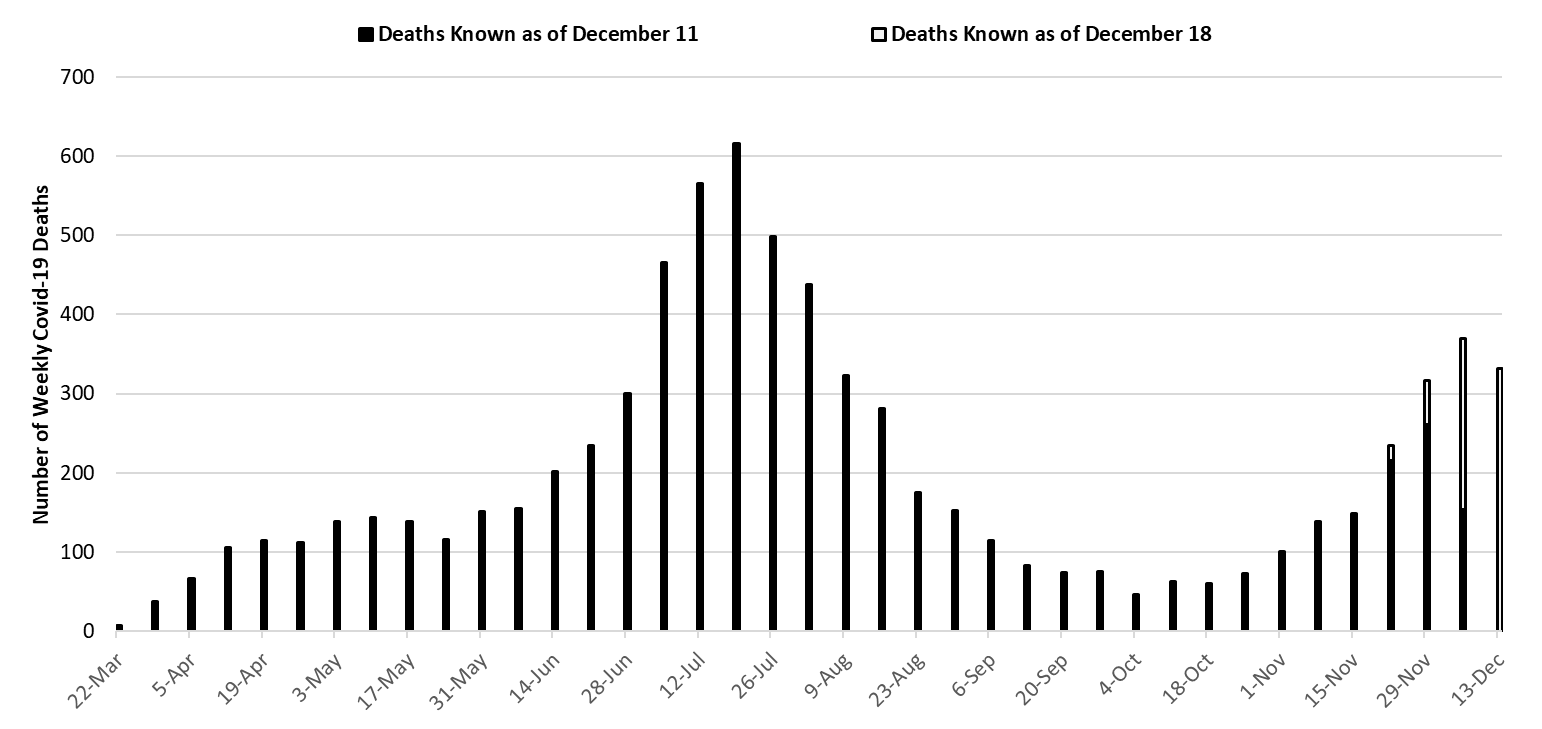
|
Figure 7. Weekly Arizona Covid-19 Deaths March 1 – December 13. |
2021 Is Likely to Start Worse than 2020 Ended
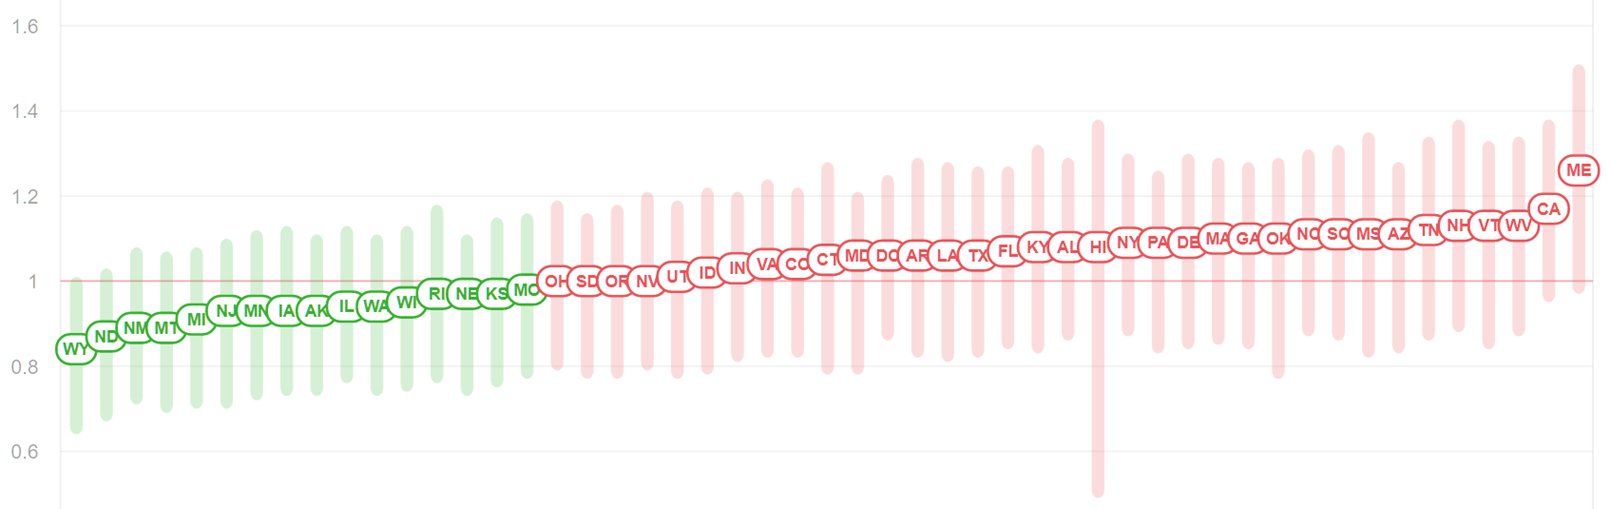
For those keeping score, Arizona has the 7th fastest increasing Covid-19 outbreak as measured by Rt.live. Arizona’s effective viral reproduction number (Rt) is now 1.11 (Figure 8).
|
Figure 8. State Comparison of Effective Reproduction Number (Rt) from Rt.live November 18, 2020. |
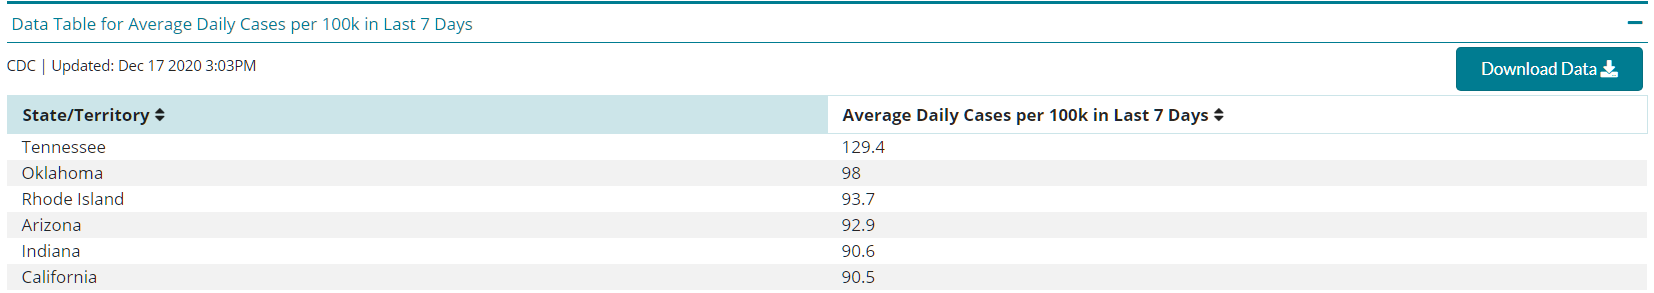
Arizona ranks 4th in the number of daily reported cases at 92.9 per 100,000 residents (Figure 9, CDC). We should move ahead of Rhode Island, 93.7 per 100,000 residents, this week.
|
Figure 9. State Comparison of Average Number of Daily Cases in past 7 Days from CDC November 18, 2020. |
Pima County Outlook
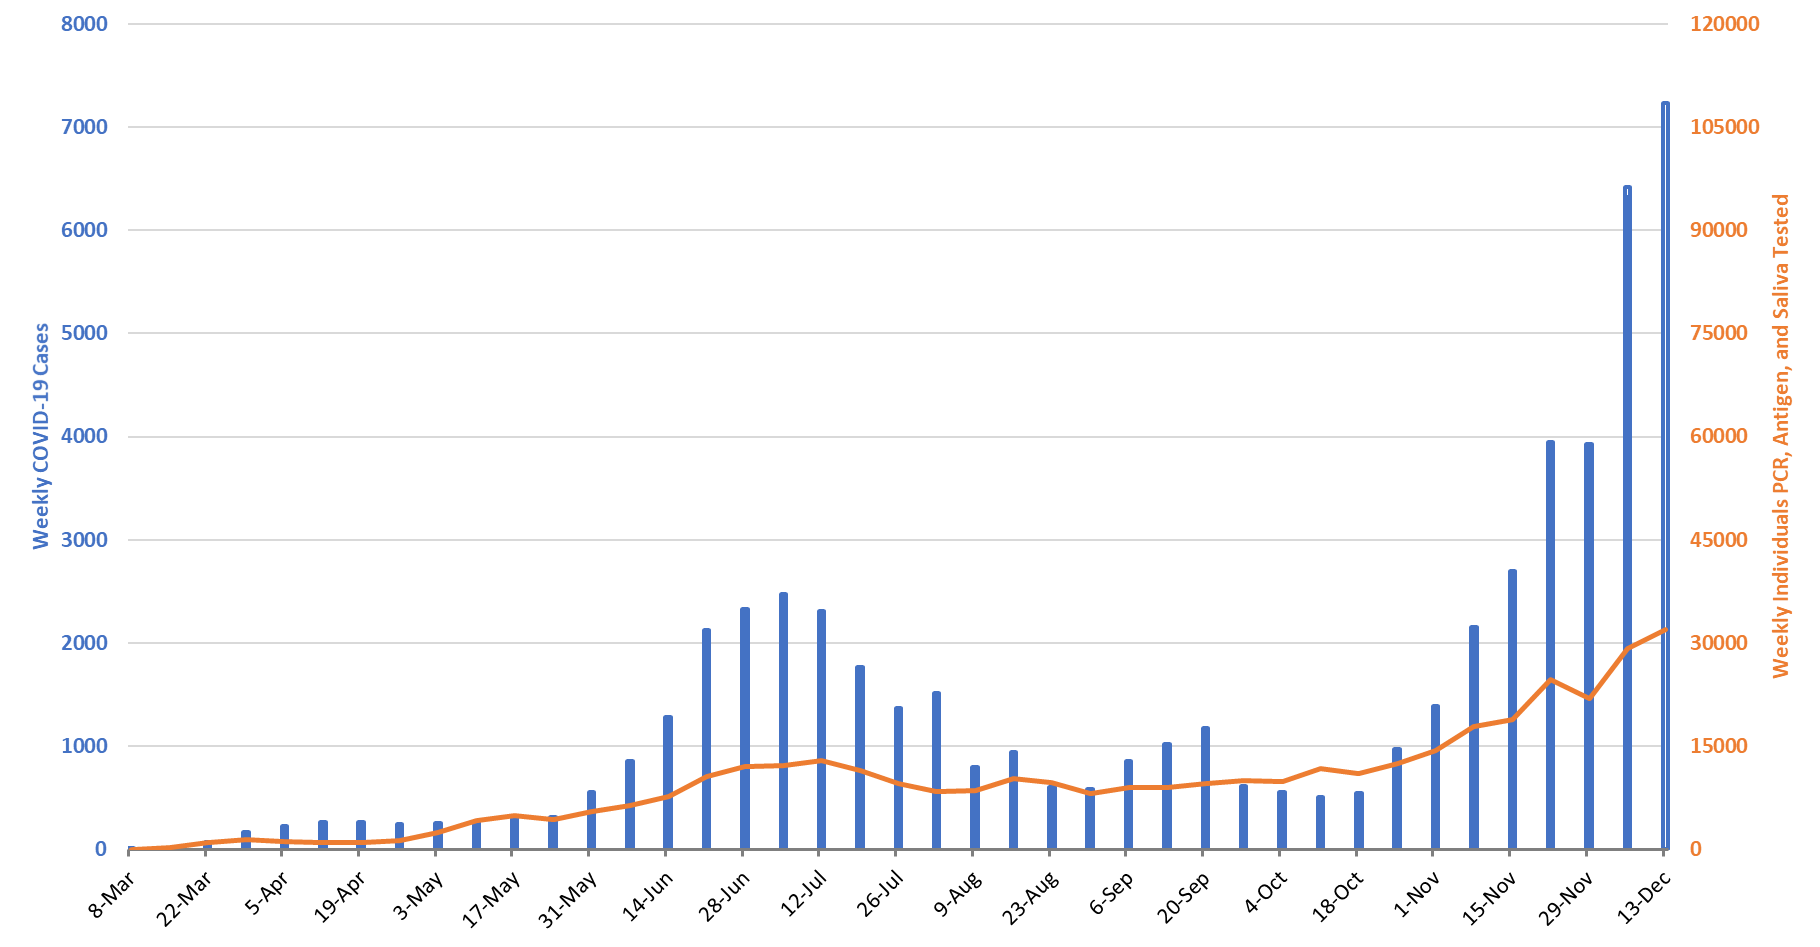
For the week ending December 13th, 7237 Pima County residents were diagnosed with Covid-19 (Figure 10). This represents a 14% increase from the 6326 cases initially reported last week. This tally once again sets a record for cases in a single week.
|
Figure 10. Covid-19 Cases and Individuals Undergoing Diagnostic Testing in Pima County Mar 1 – Dec 13. |
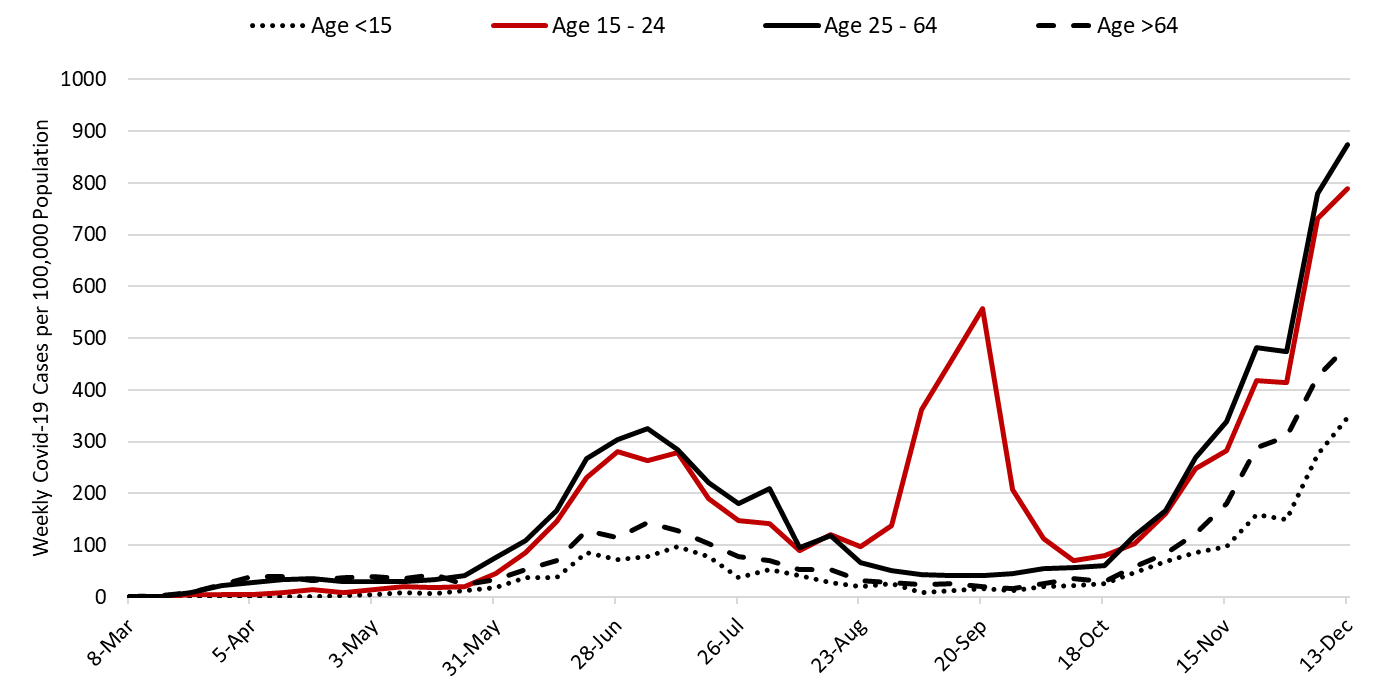
Test reporting remains relatively timely with reporting delays causing last week’s initial tally of 6326 cases to be upwardly revised by 2% (98 cases) this week. Increases in viral transmission are occurring across all age groups (Figure 11).
|
Figure 11. Covid-19 Cases by Age Group in Pima County from March 1 – December 3. |
Arizona State University Covid-19 Forecast
Once again, there was no update to the ASU Covid-19 model of projected cases, hospitalizations, and deaths through mid-January (full report). The most recent projections are shown in Figure 11. Assuming current viral transmission rates match those predicted, total Covid-19 hospitalizations in Arizona could exceed the total number of hospital beds by early January (green line).
However, actual increases in hospitalizations and ICU admissions are beginning to deviate from this track. For example, total hospital occupancy on December 18th was 4813 patients. According to the model projections, we would expect approximately 7000 hospitalized patients by Christmas Day, an increase of 2200 patients in one week’s time. This would be more than 3X the 620 patient increase observed from December 11 – December 18. For this reason, I expect the ASU model to be updated in the near future.
There are a number of reasons why Arizona may not realize the projected number of hospitalizations. The most obvious is that cases will not increase as fast as expected. However, it is also possible that hospitals are adjusting their admission criteria such that sicker patients are sent home. For example, a patient with low oxygen saturation who might have been admitted several weeks ago is now being discharged from the ED or the floor with a pulse oximeter and prescription for home oxygen therapy. Of course, both explanations could be happening simultaneously. Even if hospitalizations do not reach the heights projected as soon as projected, they are still going to reach unprecedented levels.
|
Figure 11. ASU Covid-19 Modeling Group Estimate of Total Covid-19 Hospitalization in Arizona through January 21st. Produced by Esma Gel, PhD, Megan Jehn, PhD, Anna Muldoon MPH, Health Ross, PhD, DNP, ANP-BC, and Tim Lant, PhD, MAS (November 24 Update). |
**A special thank you to the members of the ASU Covid-19 Modeling Group for their efforts to bring greater understanding of the current outbreak and for sharing their report. Readers are encouraged to read the full report which can be found here.
Summary
- Viral transmission is increasing throughout Arizona. New Covid-19 cases will overwhelm our capacity to provide hospital care by early January.
- New cases are being diagnosed at a rate of at least 610 cases per 100,000 residents per week. This rate is increasing by approximately 22 cases per 100,000 residents per week.
- We have now all but locked in a major humanitarian crisis during the Christmas – New Year holiday with hundreds of preventable deaths per week.
- Holiday travel, commerce, and social gatherings between now and New Years are likely to accelerate transmission rates without additional public health interventions.
- A state-wide shelter-in-place order is warranted to slow transmission and to mitigate the worst of overcrowding in our hospital system. A state-wide mask mandate is also needed. Individuals and business who do not comply with restrictions should face sanctions.
- If such actions are taken, they must be accompanied by additional state funds to alleviate food insecurity, to prevent evictions and foreclosures, and to protect access to health services as the loss of economic support from the CARES Act is a likely contributor to increased transmission.
- Acknowledging that a shelter-in-place order is unlikely, counties should be granted additional authority to establish and enforce alternative Covid-19 mitigation policies.
- All Arizona residents should wear a mask in public, avoid social gatherings, maintain physical distance from non-household contacts, avoid >15 minutes contact in indoor spaces, especially if physical distancing is inadequate and adherence to face masks is low.
- Hospital Covid-19 occupancy has now exceeded the previous peak number of hospitalized patients and ICUs will set new records early next week. By early January hospital capacity will be overwhelmed by new Covid-19 cases
- Hospitals are already postponing scheduled procedures; essentially additional capacity is being created at the expense of others with serious non-Covid medical conditions. However, this coping mechanism will be exhausted by the end of the month.
- Health professionals are being asked to work additional hours and assume new duties. Shortages and burn-out will degrade our capacity to provide critical care services over the coming weeks.
- The test positive rate for traditional PCR testing reached 26% this week. The growing mismatch between testing capacity and demand indicates viral transmission is growing faster than estimated here.
- Covid-19 mortality continues to increase. While case fatality rates remain lower than those observed with this summer’s outbreak, deaths are rising quickly. Arizona will record >500 Covid-19 deaths per week by Christmas.
Forecast reports to date, available as PDFs
Download PDF to view additional charts of Arizona counties, available in appendix of report.
Based on what we know now about this pandemic, we support guidelines for social distancing to slow the spread of the virus and urge everyone to follow the recommendations provided by the Centers for Disease Control and Prevention (CDC) to protect yourself, your family, your neighbors, and your employees. Please heed the recommendations as provided by the CDC, found at the following website: https://www.cdc.gov/coronavirus/2019-ncov/prepare/prevention.html
COVID covid coronavirus virus covid19 corona forecast model

