


Note this forecast page is not the most recent forecast available.
View the most current forecast report
Researcher Analyzes Arizona COVID-19 Spread Models for Decision-Makers
The following information regarding the spread of COVID-19 in Arizona was prepared by Joe Gerald, MD, PhD, a researcher at the Mel and Enid Zuckerman College of Public Health (MEZCOPH) at the University of Arizona. This information has also been reviewed by other MEZCOPH faculty.
This data were obtained from the Arizona Department of Health Services COVID-19 webpage and reflect conditions in Arizona as of December 28, 2020.
This information is intended to help guide our response to the outbreak. It is not intended to predict how this pandemic will evolve. Rather, this model extrapolates what might occur if current conditions remain unchanged. As regional authorities and healthcare providers respond, their actions are expected to mitigate the worst consequences of this pandemic.

COVID-19 Disease Outbreak Forecast
Arizona State and Pima County
Updated December 28, 2020
Disclaimer: This information represents my personal views and not those of The University of Arizona, the Zuckerman College of Public Health, or any other government entity. Any opinions, forecasts, or recommendations should be considered in conjunction with other corroborating and conflicting data. Updates can be accessed at https://publichealth.arizona.edu/news/2020/covid-19-forecast-model.
**NOTICE** Arizona is experiencing a public health crisis where access to critical care services is limited due to shortages of space, personnel, and critical supplies. At this point, only shelter-in-place restrictions are certain to quickly and sufficiently curtail viral transmission. Because such restrictions impose substantial economic hardships, these measures should be augmented by state expansion of programs to provide direct economic assistance, reduce food insecurity, prevent foreclosure and evictions, and protect access to health services.
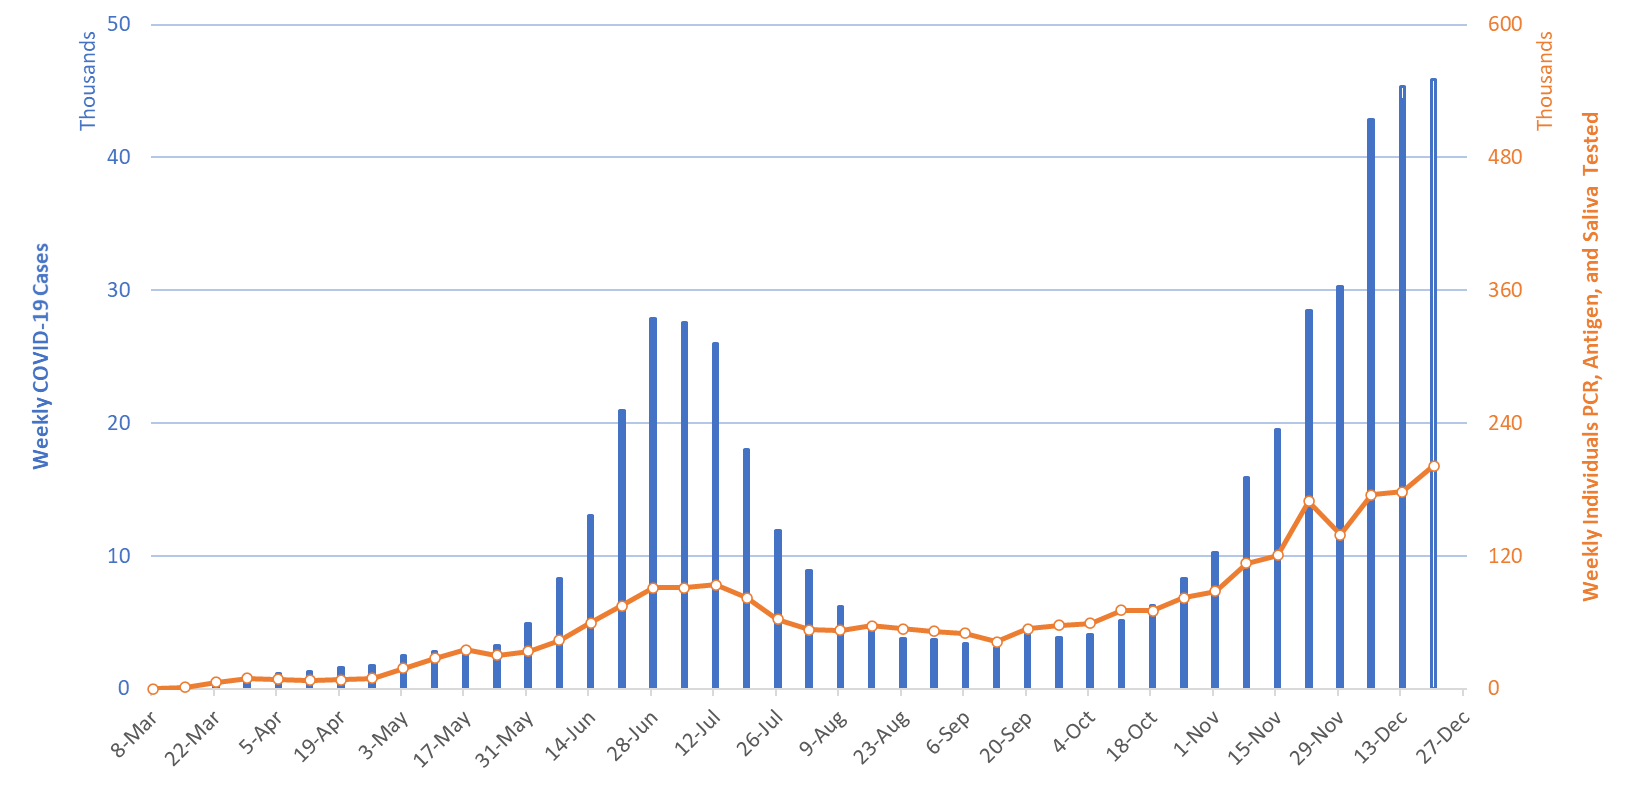
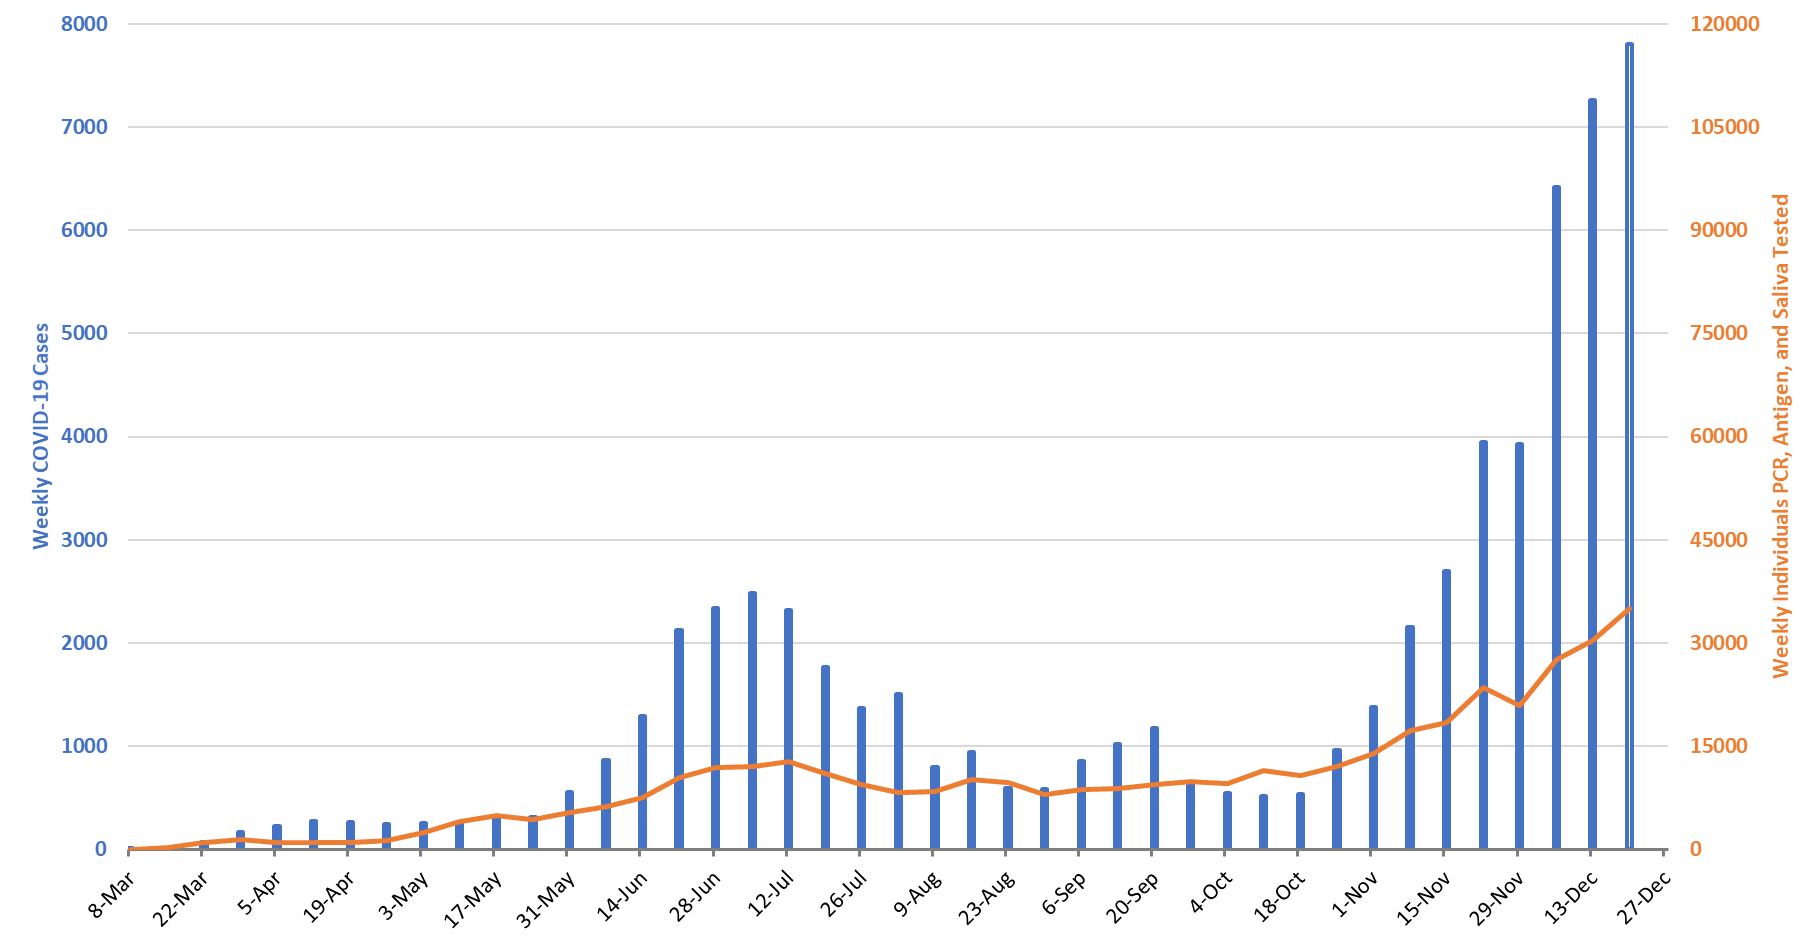
For the week ending December 20th, at least 45858 new Covid-19 cases were diagnosed in Arizona (Figure 1). This is a 6% increase from last week’s initial tally of 44390 cases and a new state record. The previous week’s tally was upwardly revised by 965 cases, a 2% increase. Test capacity continues to rise; however, test positivity held steady for the first time in many weeks at 26%.
|
Figure 1. Newly Diagnosed Covid-19 Cases in Arizona and Number of Individuals Undergoing Covid-19 Diagnostic Testing March 1 through December 20. |
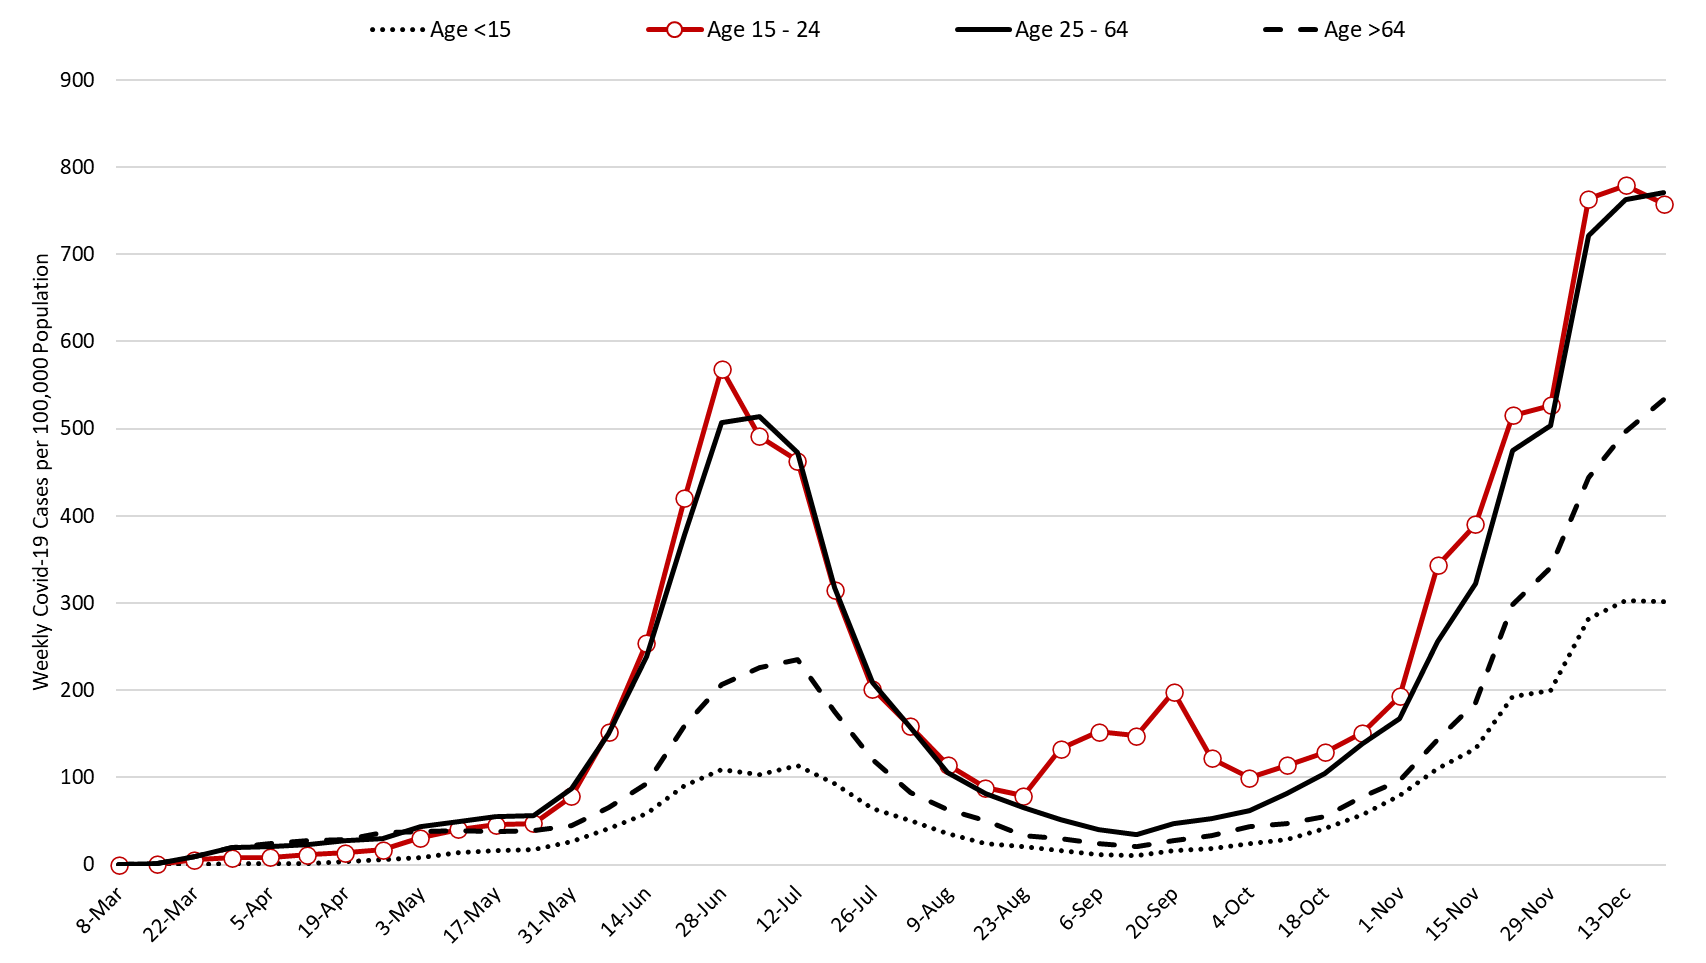
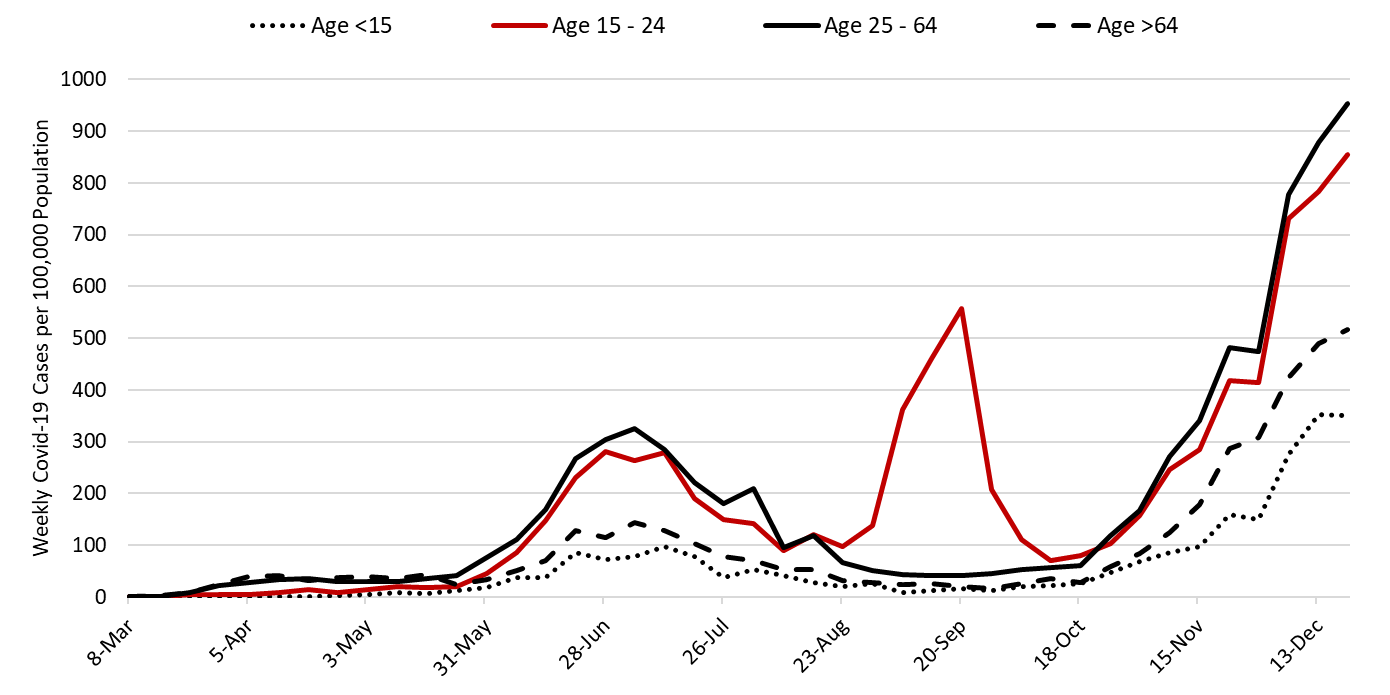
While the outbreak remains broadly entrenched, there has been some moderation among adolescents, young adults, and working-age adults. However, cases among those >64 years of age who are at highest risk of hospitalization, ICU admission, and mortality continues to increase (Figure 2). Therefore, hospitals are likely to experience increasing occupancy into early January.
Note: Data for this report was updated Monday, December 28 allowing 7 full days to adjudicate cases and keep week-over-week backfill <10%. This allows more interpretable comparisons and graphics. All comparisons are week-over-week changes. The next update will be released on Tuesday.
|
Figure 2. Newly Diagnosed Covid-19 Cases in Arizona by Age Group March 1 through December 20. |
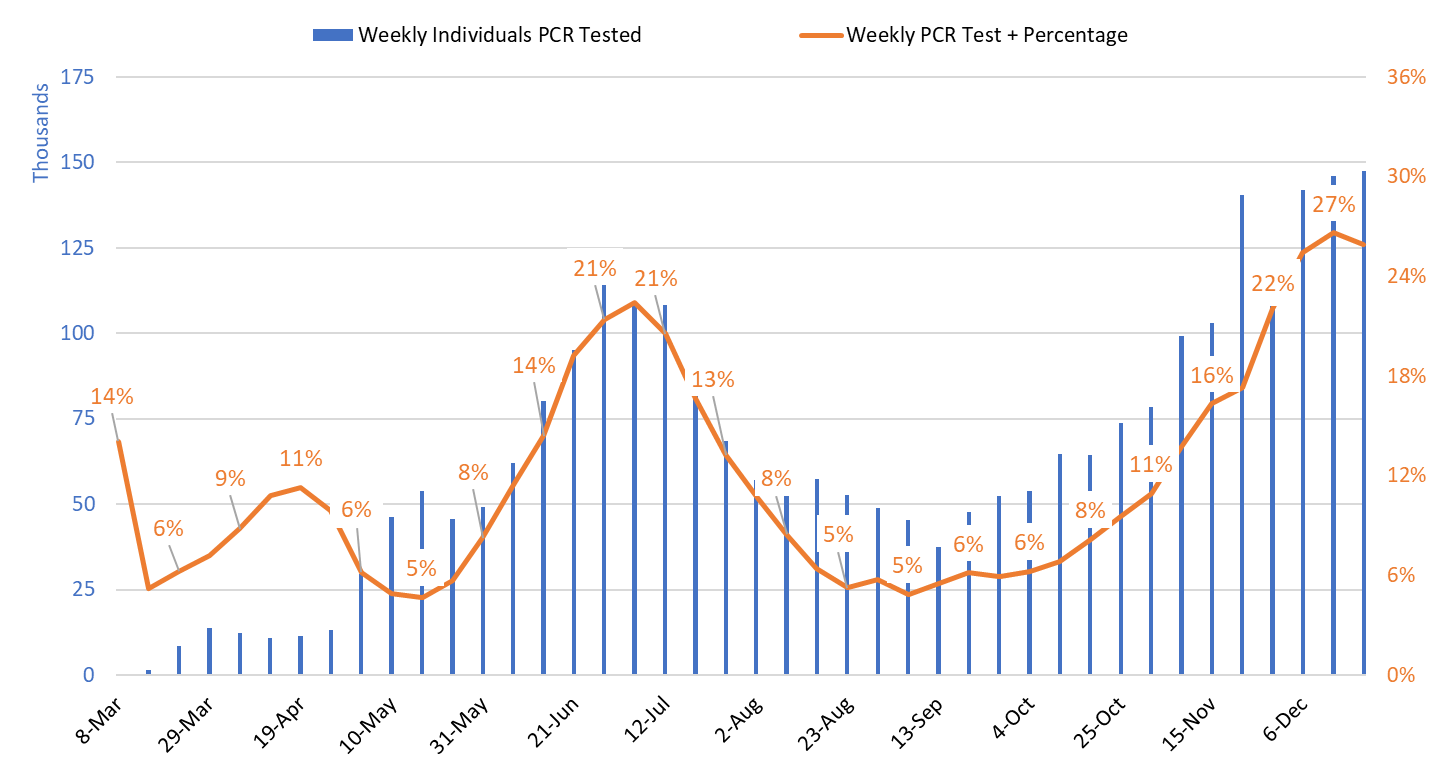
Test positivity among those undergoing traditional PCR testing has plateaued, at least temporarily. Last week it was 26.6%; this week it was 25.9% (Figure 3). This suggests that there has been some moderation in the pace of viral transmission despite the uncertainty surrounding the precise case count.
|
Figure 3. Weekly Number Patients Traditional PCR Testing and Percent Positivity March 1 – December 20. |
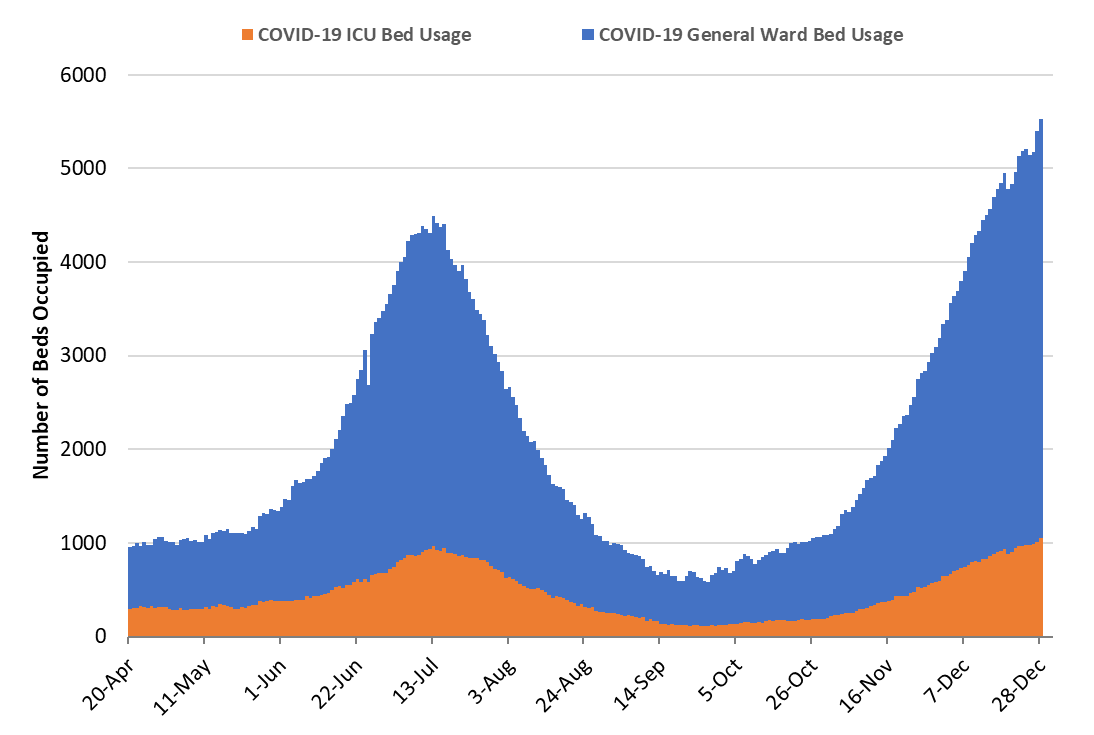
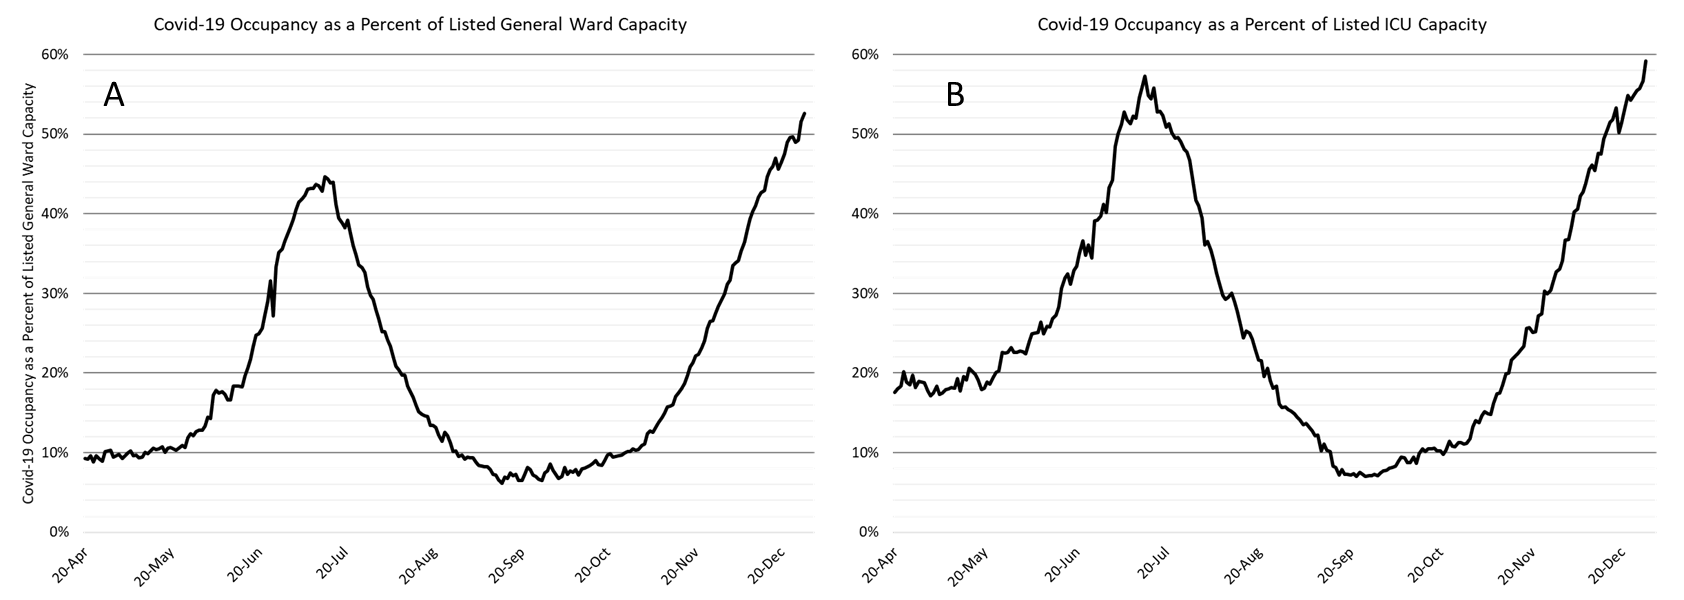
As of December 28th, 4475 (53%) of Arizona’s 8505 general ward beds were occupied by Covid-19 patients, an 11% increase from last week’s 4019 occupied beds (Figure 4 and Figure 5 Panel A). Another 765 (9%) beds remained available for use. The number of available beds is higher than last week’s 742 beds.
At 4475 beds and 53% occupancy, Arizona has once again established new records for ward Covid-19 patients and percent occupancy.
|
Figure 4. Arizona Daily Covid-19 General Ward and ICU Census April 20 – December 28. |
As of December 28th, 1053 (59%) of Arizona’s 1779 ICU beds were occupied with Covid-19 patients, a 12% increase from last week’s count of 943 patients (Figure 4 and Figure 5 Panel B). An additional 154 (9%) ICU beds remain available. This is lower than last week’s 161 beds. Covid-19 occupied ICU beds and percent occupancy have never been higher in Arizona.
|
Figure 5. Covid-19 Occupancy as a Percent of Listed General Ward (A, left) and ICU (B, right) Capacity in Arizona April 20 – December 28. |
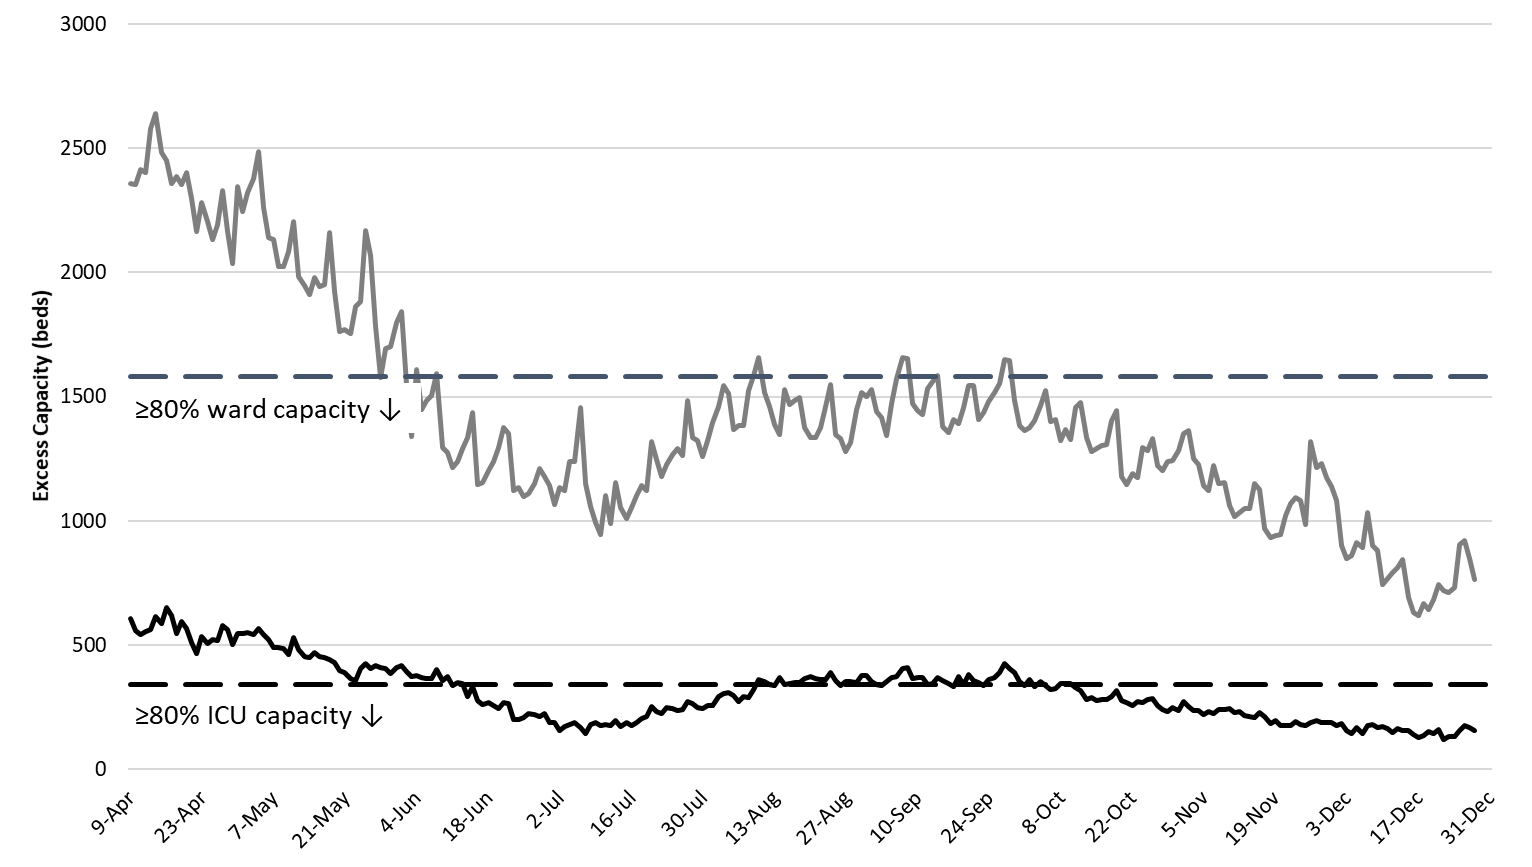
Arizona hospitals’ safety margin continues to erode in the ward and ICU (Figure 6). Most hospitals have cancelled scheduled procedures to ensure adequate capacity for patients with Covid-19 care.
We are now undergoing the great “displacement” such that hospital services are now being rationed so that patients with severe Covid-19 illness are displacing others who have slightly less severe non-Covid medical conditions.
|
Figure 6. Observed Excess Non-Surge General Ward and ICU Capacity April 20 – December 28. |
As Covid-19 illness continues to increase, delaying others’ care will become ever more difficult. At some point, hospitals will have to expand their physical capacity. Make no mistake, the Covid-19 crisis is now placing a greater share of Arizonans’ at-risk, not just those unfortunate enough to contract Covid-19. It is also important to recognize that hospital admission and discharge practices are changing in concert with management of non-Covid-19 patients. Today, Covid-19 patients are likely being discharged home sooner and must have higher average severity to be admitted to the hospital and ICU. Furthermore, many who would have been transferred to a tertiary care facility are being managed at smaller, more rural hospitals.
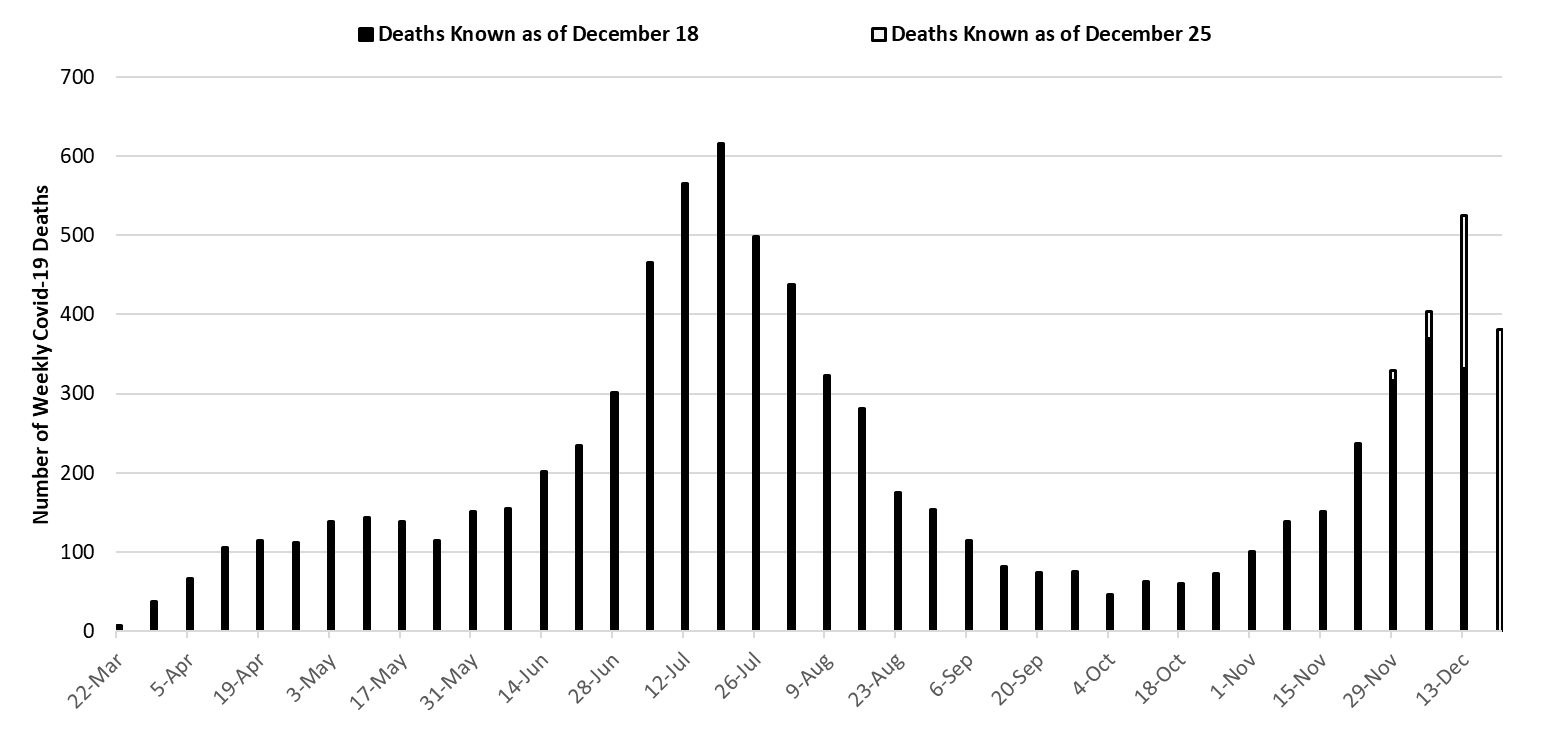
While the week ending July 19th remains Arizona’s deadliest week with 617 deaths, the week ending December 13th has now seen 525 recorded deaths (Figure 7). This number will rise further over the coming weeks as more deaths are made known. Covid-19 deaths are expected to exceed 500 weekly for the foreseeable future and may reach a new record by late December. Recall that deaths lag new cases by 14-days and are often only known weeks later. As a rule of thumb, multiplying the number of weekly cases by 1.5%, the case fatality rate, will approximate the number of Covid-19 deaths in 2 – 3 weeks’ time.
|
Figure 7. Weekly Arizona Covid-19 Deaths March 1 – December 20. |
2021 Is Likely to Start Like 2020 Ended
For those keeping score, Arizona now has the 32nd fastest increasing Covid-19 outbreak as measured by Rt.live. This is down dramatically from 10 days ago and Rt.live actually suggests Arizona’s effective viral reproduction number (Rt) is now below the important benchmark of 1.0 suggesting that viral transmission is now declining (Figure 8).
|
Figure 8. State Comparison of Effective Reproduction Number (Rt) from Rt.live November 28, 2020. |
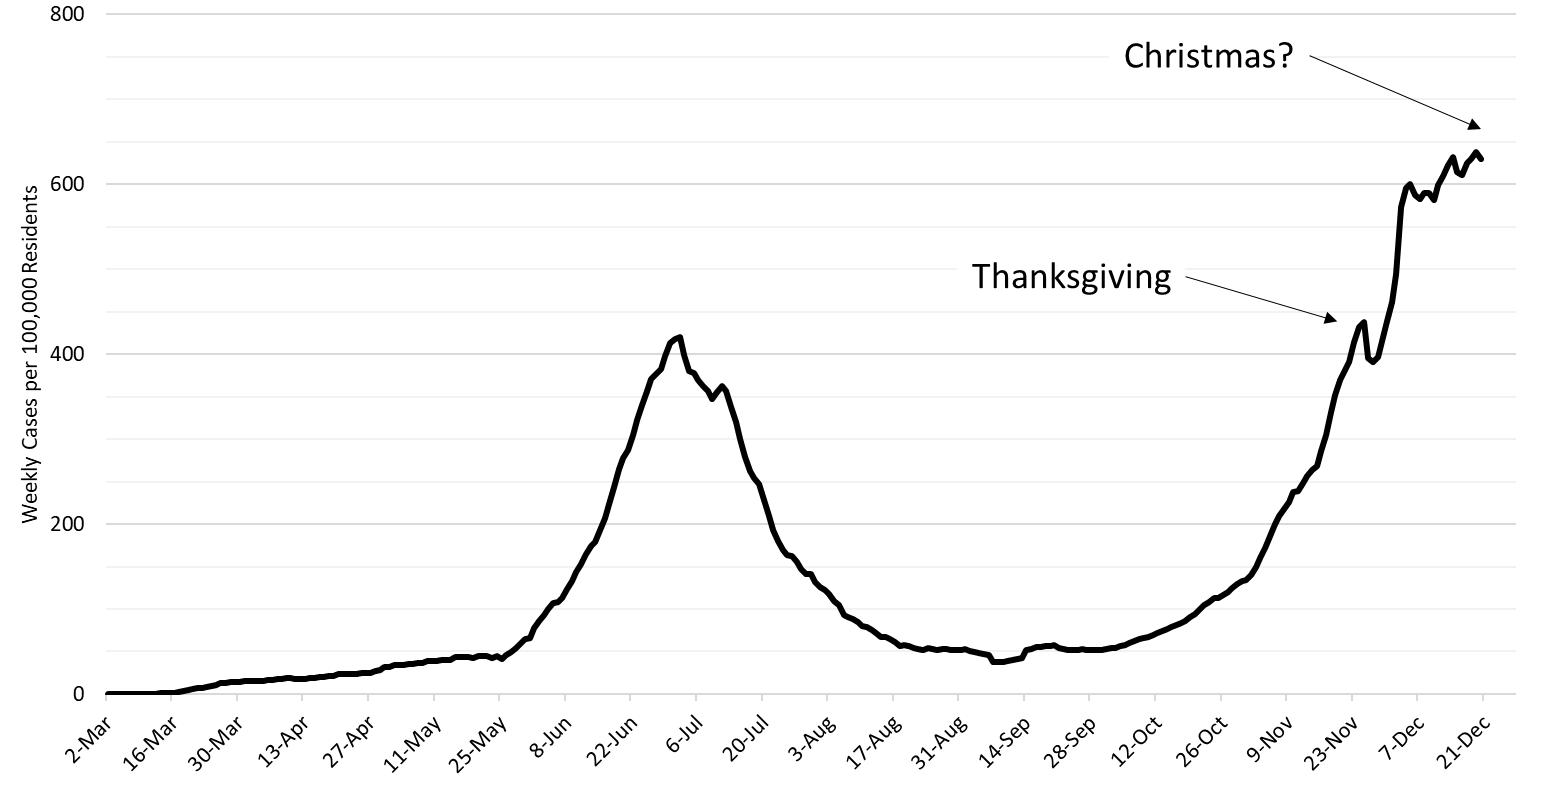
While viral transmission as measured by reported cases has moderated since early December, it is premature to believe we will see a sustained decline into January. It is more likely that Rt.live is capturing the behavioral impact of Christmas on access to testing and willingness to test. This effect is visible during Thanksgiving when the case rate declined but then quickly rebounded (Figure 9). We should be prepared for the possibility of a similar pattern repeating during Christmas. Note: Because this report tracks case counts by date of test collection it does not yet include data from Christmas week. However, Rt.live follows case counts as they are reported and does.
|
Figure 9. 7-day Moving Average of Number of Daily Covid-19 Cases in Arizona March 1 – December 20. |
Pima County Outlook
For the week ending December 20th, 7810 Pima County residents were diagnosed with Covid-19 (Figure 10). This represents an 8% increase from the 7237 cases initially reported last week. This tally once again sets a record for cases in a single week.
|
Figure 10. Covid-19 Cases and Individuals Undergoing Diagnostic Testing in Pima County Mar 1 – Dec 20. |
Test reporting remains relatively timely with reporting delays causing last week’s initial tally of 7237 cases to be upwardly revised by <1% (29 cases) this week. Increases in viral transmission are occurring across all age groups (Figure 11).
|
Figure 11. Covid-19 Cases by Age Group in Pima County from March 1 – December 20. |
Summary
- Viral transmission continues to increase in Arizona albeit more modestly than in past weeks. However, major behavioral changes in the way Arizonans work, socialize, and access medical care during the holidays is making it difficult to ascertain underlying trends. We should be prepared for the possibility that measured case rates return to their pre-Christmas trends in the coming weeks.
- As of December 20th, new cases were being diagnosed at a rate of at least 630 cases per 100,000 residents per week. This rate was increasing by approximately 7 cases per 100,000 residents per week.
- Since the second week in December, Arizona has been experiencing >500 Covid-19 deaths per week, many of which were preventable had the state more aggressively adopted evidenced-based public health practices.
- Holiday travel, commerce, and social gatherings over the Christmas – New Years’ holiday has not accelerated transmission as measured by reported cases. However, some caution is warranted as a similar short-lived “dip” was also observed during Thanksgiving.
- A state-wide shelter-in-place order remains warranted to slow transmission and to mitigate the worst of overcrowding in our hospital system. A state-wide mask mandate is also needed. Individuals and business who do not comply with restrictions should face sanctions.
- If such actions are taken, they must be accompanied by additional state funds to alleviate food insecurity, to prevent evictions and foreclosures, and to protect access to health services as the disruption of economic support between the CARES Act and the newest relief legislation will leave a small gap in benefits.
- Acknowledging that a shelter-in-place order is unlikely, counties should be granted additional authority to establish and enforce alternative Covid-19 mitigation policies.
- All Arizona residents should wear a mask in public, avoid social gatherings, maintain physical distance from non-household contacts, avoid >15 minutes contact in indoor spaces, especially if physical distancing is inadequate and adherence to face masks is low.
- Hospital Covid-19 occupancy continues to increase with each day setting new records for ward and ICU occupancy. By early-to-mid January hospital capacity could be overwhelmed by new Covid-19 cases.
- Hospitals continue to postpone scheduled procedures to create additional capacity for Covid-19 patients at the expense of others with serious medical conditions. This coping mechanism could be exhausted soon if admissions continue to increase.
- Health professionals are being asked to work additional hours and assume new duties. Shortages and burn-out will degrade our capacity to provide critical care services over the coming weeks.
- The test positivity rate for traditional PCR testing remains at record levels, 26% this week. The mismatch between testing capacity and demand indicates viral transmission is growing faster than estimated here.
Forecast reports to date, available as PDFs
Download PDF to view additional charts of Arizona counties, available in appendix of report.
Based on what we know now about this pandemic, we support guidelines for social distancing to slow the spread of the virus and urge everyone to follow the recommendations provided by the Centers for Disease Control and Prevention (CDC) to protect yourself, your family, your neighbors, and your employees. Please heed the recommendations as provided by the CDC, found at the following website: https://www.cdc.gov/coronavirus/2019-ncov/prepare/prevention.html
COVID covid coronavirus virus covid19 corona forecast model

