


Note this forecast page is not the most recent forecast available.
View the most current forecast report
Researcher Analyzes Arizona COVID-19 Spread Models for Decision-Makers
The following information regarding the spread of COVID-19 in Arizona was prepared by Joe Gerald, MD, PhD, a researcher at the Mel and Enid Zuckerman College of Public Health (MEZCOPH) at the University of Arizona. This information has also been reviewed by other MEZCOPH faculty.
This data were obtained from the Arizona Department of Health Services COVID-19 webpage and reflect conditions in Arizona as of April 9, 2021.
This information is intended to help guide our response to the outbreak. It is not intended to predict how this pandemic will evolve. Rather, this model extrapolates what might occur if current conditions remain unchanged. As regional authorities and healthcare providers respond, their actions are expected to mitigate the worst consequences of this pandemic.

COVID-19 Disease Outbreak Forecast
Arizona State and Pima County
Updated April 9, 2021
Disclaimer: This information represents my personal views and not those of The University of Arizona, the Zuckerman College of Public Health, or any other government entity. Any opinions, forecasts, or recommendations should be considered in conjunction with other corroborating and conflicting data. Updates can be accessed at https://publichealth.arizona.edu/news/2021/covid-19-forecast-model.
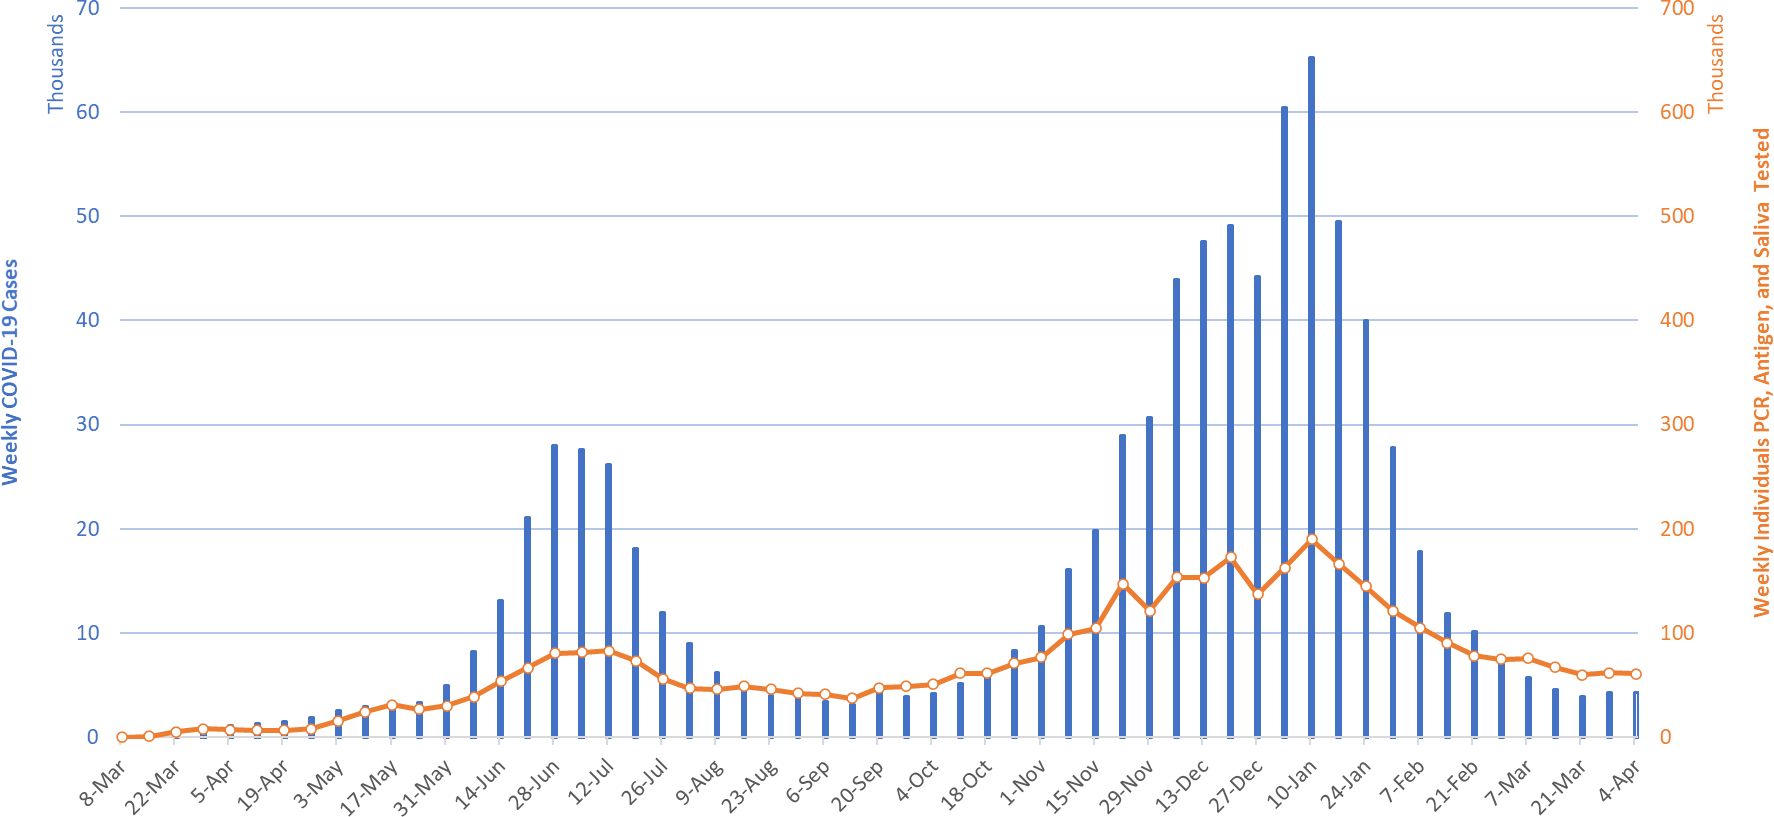
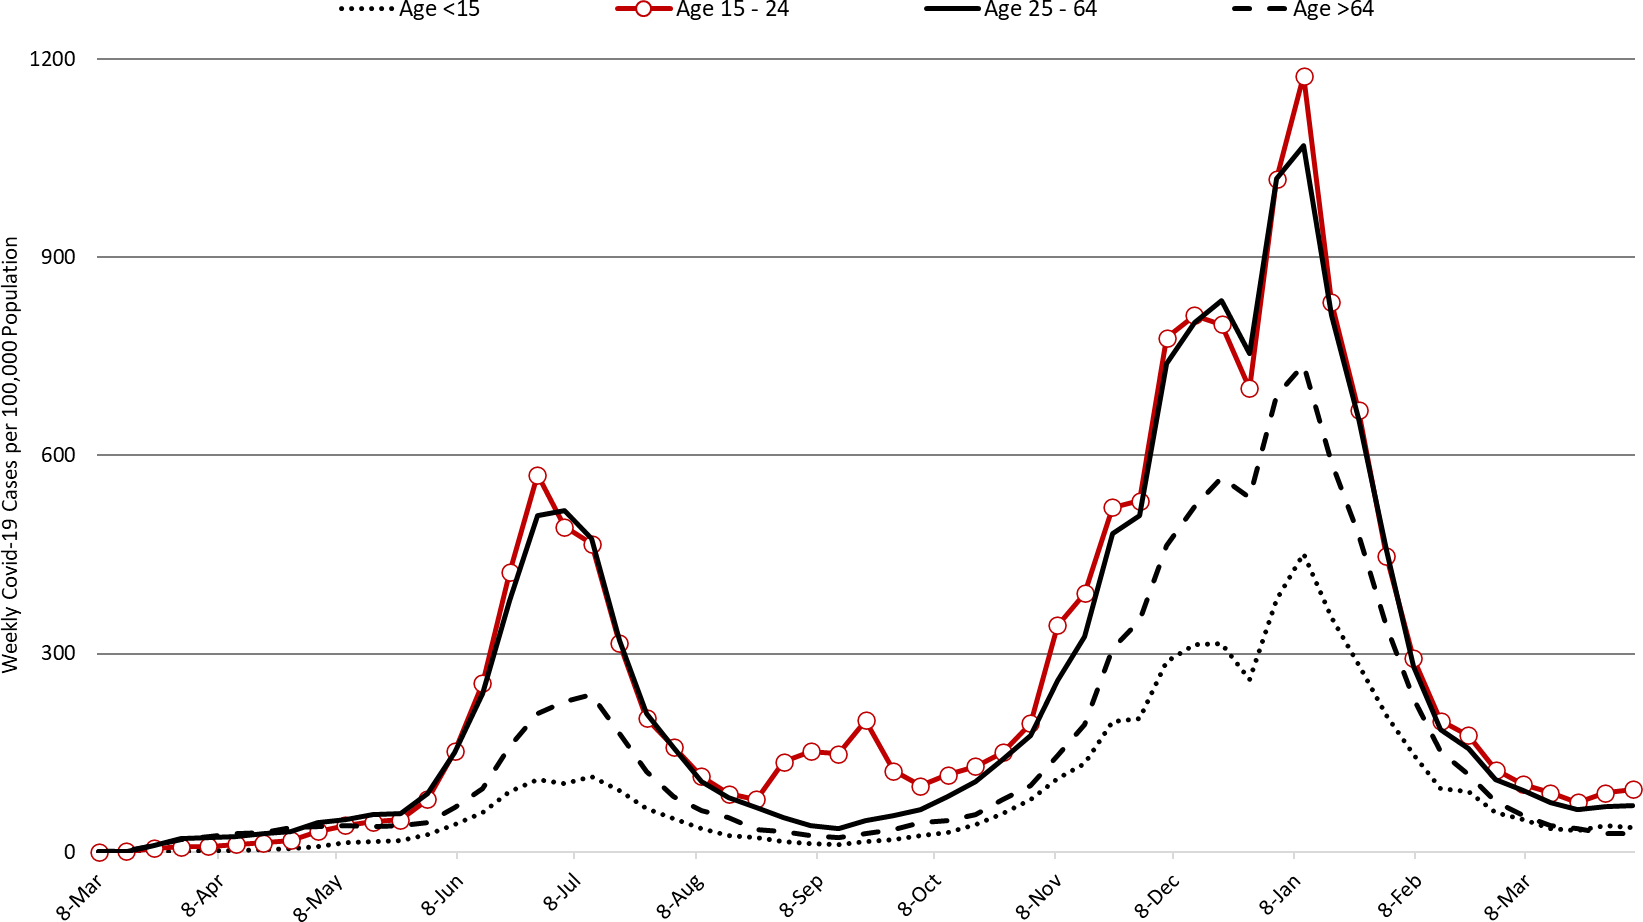
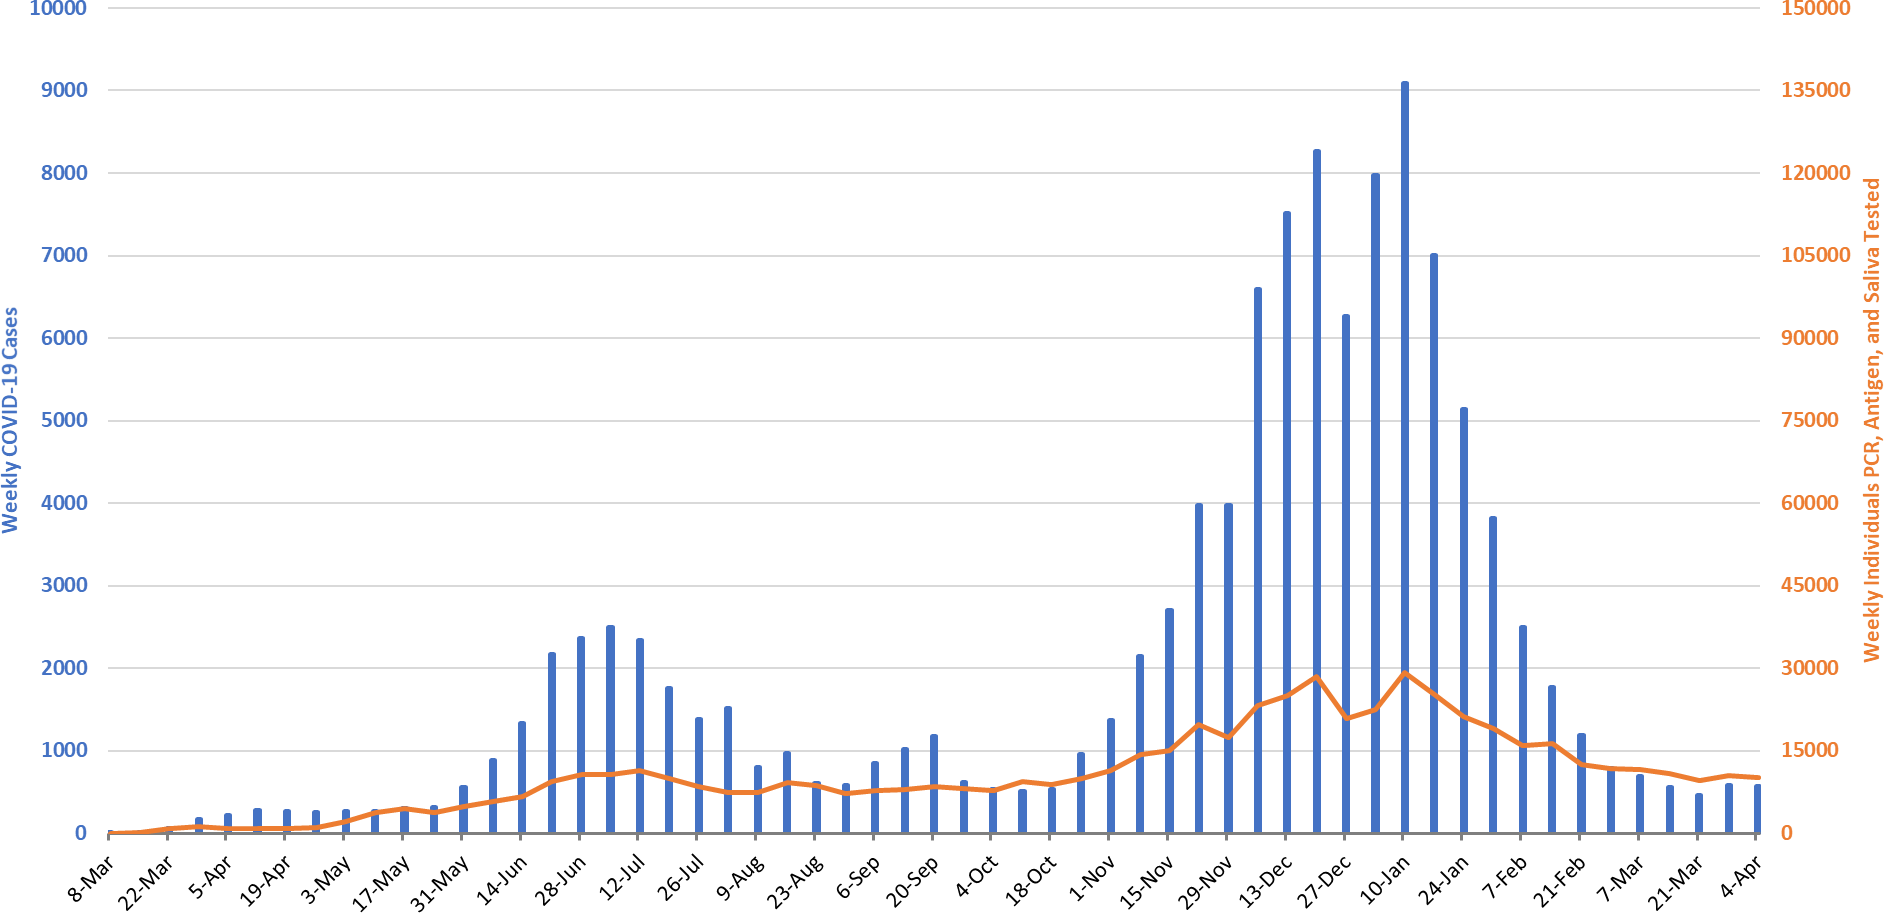
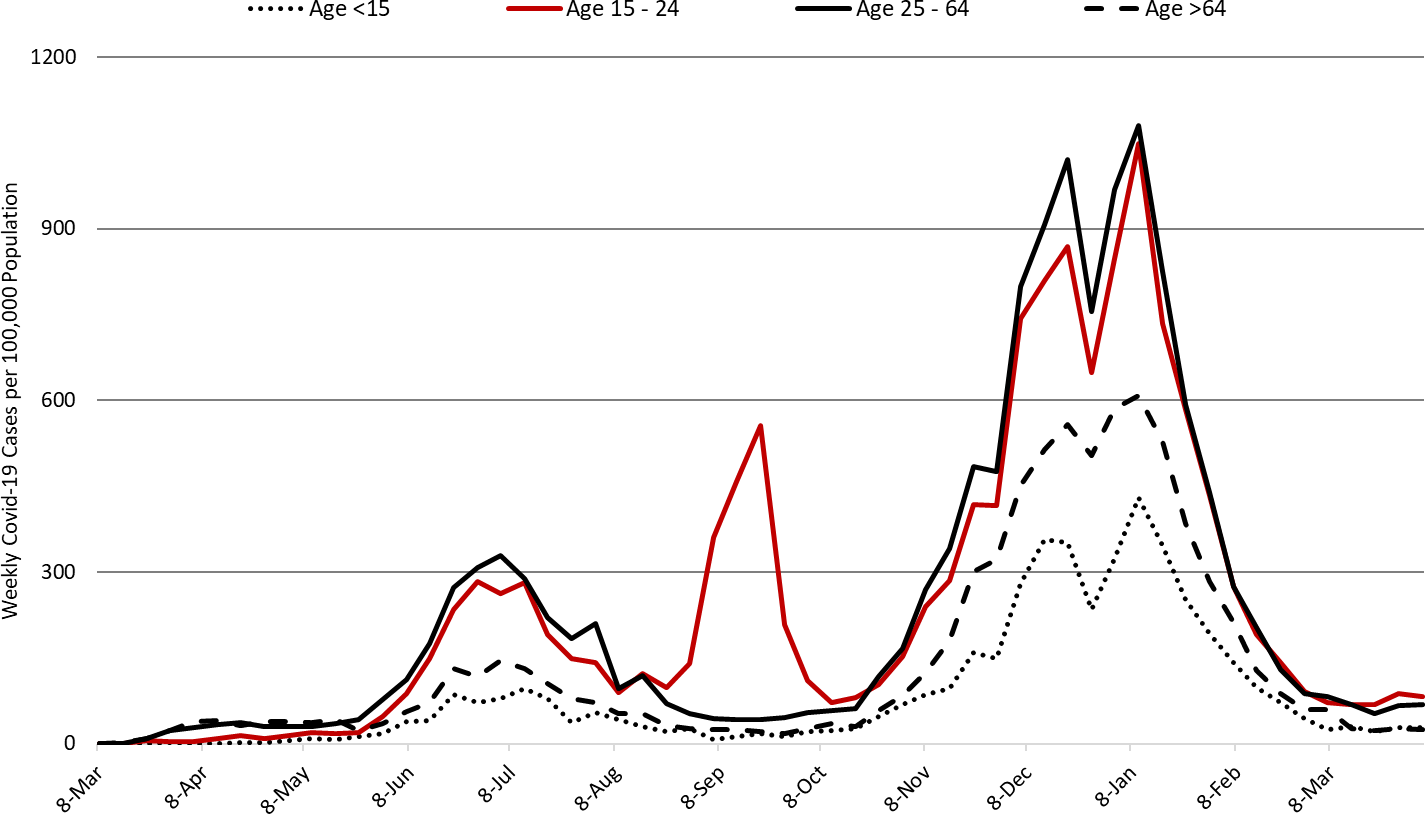
For the week ending April 4th, 4281 Covid-19 cases were diagnosed in Arizona (Figure 1). This represents a 2% increase from last week’s initial tally of 4200 cases and marks the second week of slightly increasing case rates. The prior week’s tally was upwardly revised by <1% (29 cases) to 4229 cases this week. Case rates among those ≥65 years of age have fallen below those of children for the first time, 28 versus 37 cases per 100K residents per week, respectfully (Figure 2). The highest rates remain among those 15 – 24 years and 25 – 64 years of age, 95 and 70 cases per 100K residents per week, respectfully.
|
Figure 1. Newly Diagnosed Covid-19 Cases in Arizona and Number of Individuals Undergoing Covid-19 Diagnostic Testing March 1, 2020 through April 4, 2021. |
Arizona case rates remain “stuck” just above the threshold differentiating substantial and moderate risk. As predicted in the March 26 Update, our 3-month streak of sustained improvements has stalled owing to more transmissible variants (e.g., B.1.1.7) and/or normalization of business and social activities (e.g., EO 2021-06). Nevertheless, hospital capacity remains adequate to meet Arizona’s needs even though the backlog of non- Covid care has yet to be fully addressed.
While residents and businesses should continue to follow public health recommendations, normalization of low-risk activities remains reasonable. New cases are now being diagnosed at a rate of 59 per 100K residents per week; this rate is neither increasing nor decreasing. For reference, September 8th marked the fall nadir between the summer and winter outbreaks at 38 cases per 100K residents per week. Post-holiday case rates reached a low of 53 cases per 100K residents on March 23, 2021.
Unvaccinated Arizonans who are at risk of developing severe disease (e.g., age or comorbid conditions) or who simply wish to remain uninfected should continue to shelter as much as feasible because viral activity remains widespread.
Note: Data for this report was updated Friday, April 9 allowing 4 full days to adjudicate cases and keep week-over-week backfill <10%. This allows more interpretable comparisons and graphics. All comparisons are week-over-week changes.
|
Figure 2. Newly Diagnosed Covid-19 Cases in Arizona by Age Group March 1, 2020 through April 4, 2021. |
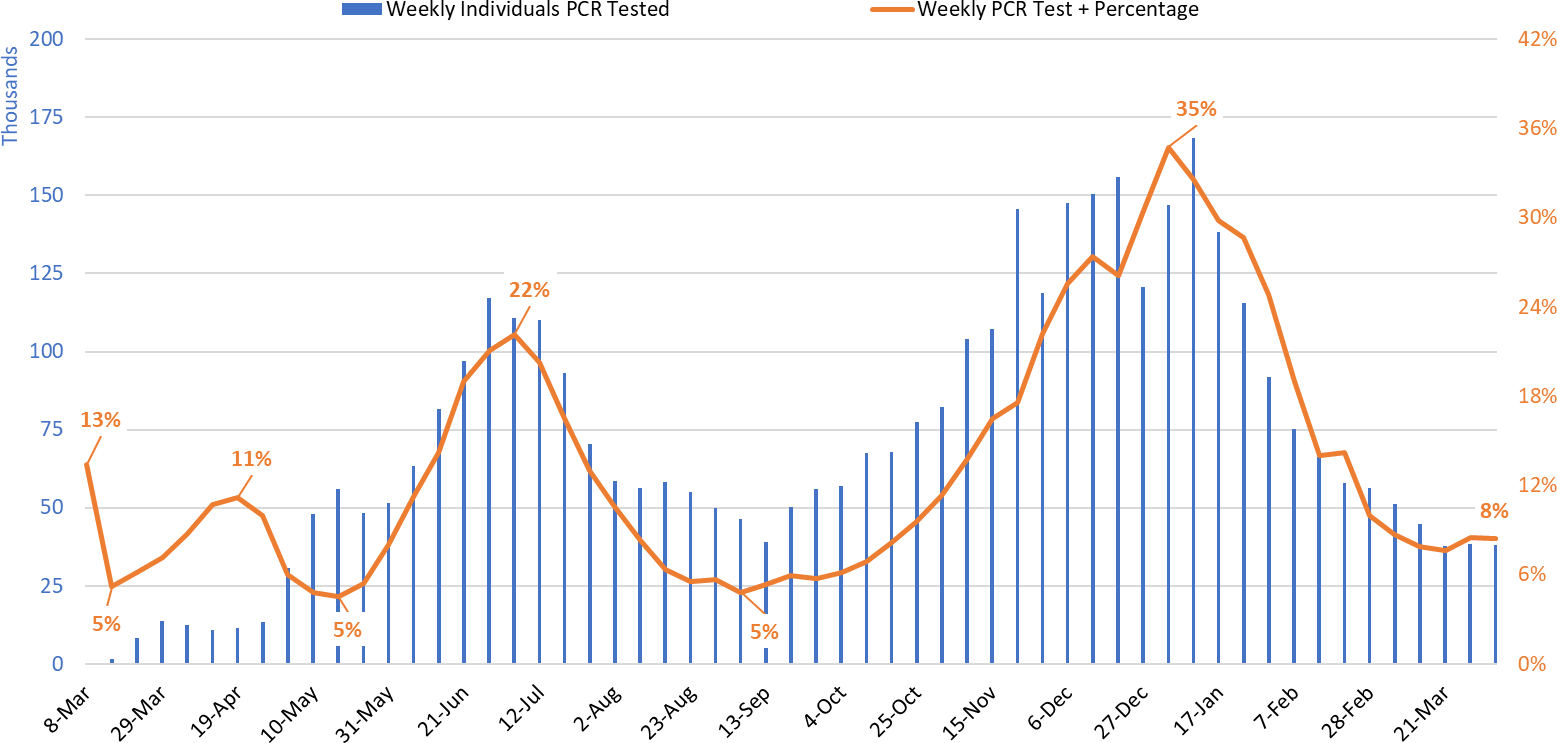
Test positivity among those undergoing traditional nasopharyngeal PCR testing is continuing to hold steady at 8% (Figure 3). Positivity remains within the recommended 5 – 10% window for optimal public health practice.
|
Figure 3. Weekly Number Patients Undergoing Traditional Nasopharyngeal PCR Testing and Associated Percent Positivity March 1, 2020 – April 4, 2021. |
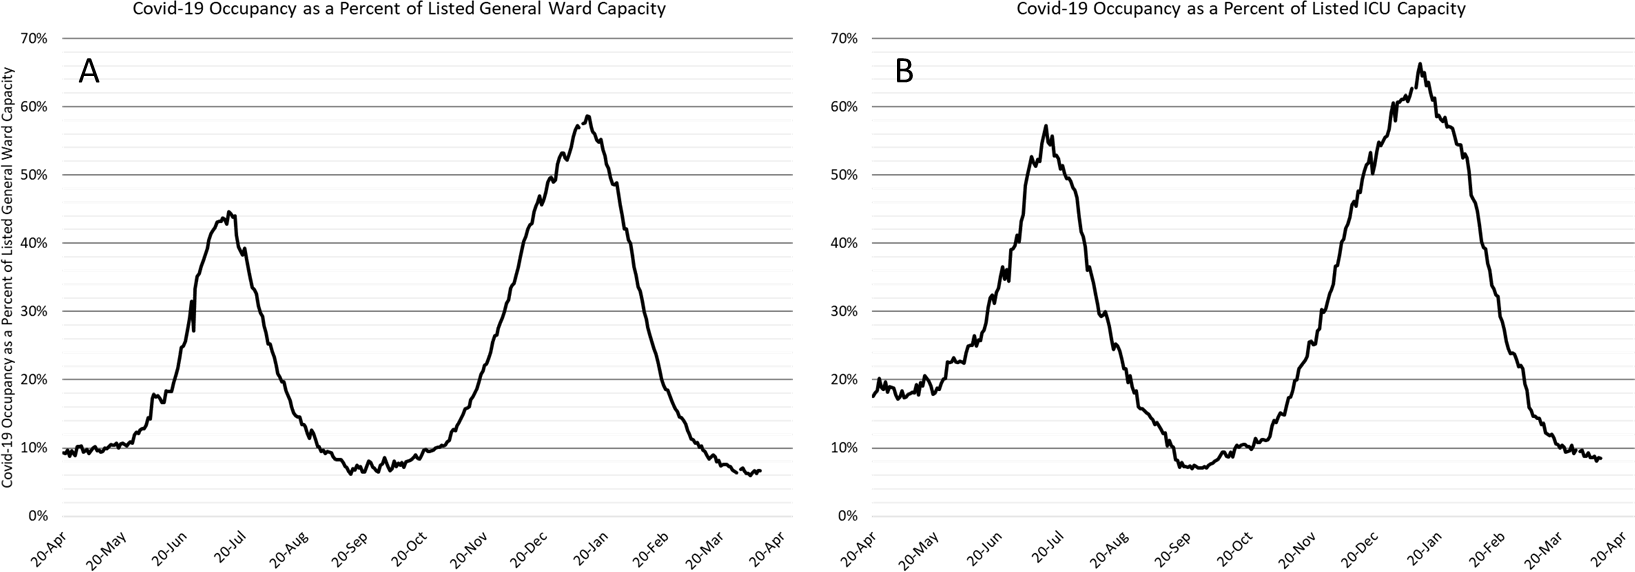
As of April 9th, 576 (7%) of Arizona’s 8571 general ward beds were occupied by Covid-19 patients, a 6% increase from the previous week’s 541 occupied beds (Figure 4 and Figure 5 Panel A). This represents the first increase in 3 months. Another 985 (11%) beds remained available for use. The number of available beds is higher than the previous week’s 931 beds.
Covid-19 occupancy has dropped by 89% from its January 11th peak of 5082 ward patients. The summer-fall nadir was 468 occupied beds on September 27th.

|
Figure 4. Arizona Daily Covid-19 General Ward and ICU Census April 20, 2020 – April 9, 2021. |
As of April 4th, 147 (9%) of Arizona’s 1734 ICU beds were occupied with Covid-19 patients, a 4% decrease from the prior week’s count of 153 patients (Figure 4 and Figure 5 Panel B). An additional 256 (15%)
ICU beds remained available for use. This is similar to the prior week’s 264 available beds. ICU occupancy has fallen 88% from its January 11th peak of 1183 occupied beds. The summer-fall nadir was 114 occupied beds on September 22nd.
|
Figure 5. Covid-19 Occupancy as a Percent of Listed General Ward (A, left) and ICU (B, right) Capacity in Arizona April 20, 2020 – April 9, 2021. |
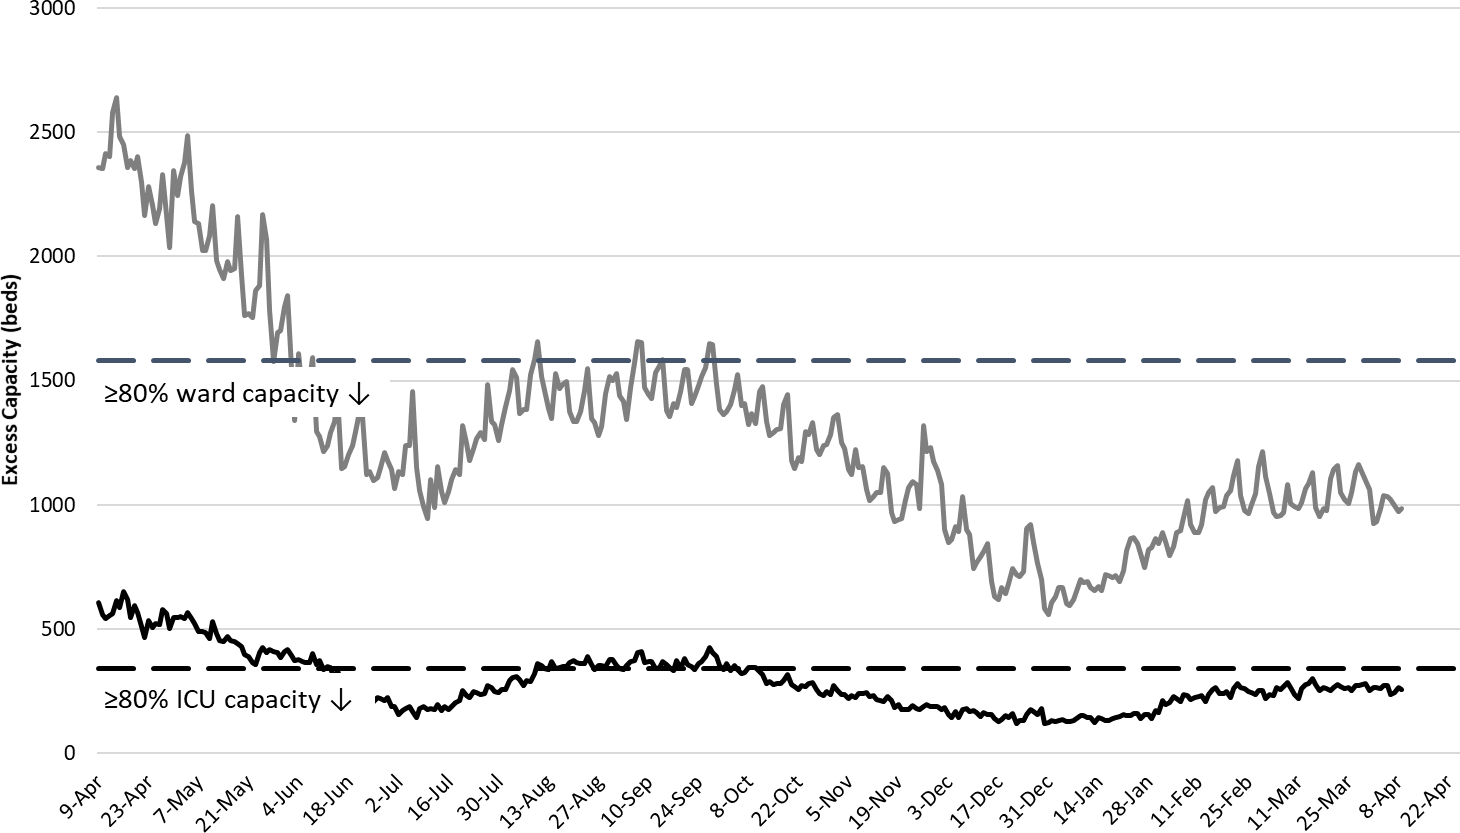
Arizona hospital occupancy remains above seasonal trends. Improvements in ward and ICU occupancy remain stalled at ≥85% occupancy (Figure 6, following page). This indicates that medically necessary procedures that were previously postponed are being scheduled at higher than seasonal amounts to address the backlog of care. It will still take several more months to resolve. Occupancy will need to fall <70-75% before conditions will be back to “normal.” As capacity constraints are lessened, care practices should return to those prior to the outbreak ensuring all patients will receive optimal care. Hospitals will remain crowded through April - May before returning to pre-outbreak levels especially since reductions in viral transmission have stalled.
|
Figure 6. Observed Excess Non-Surge General Ward and ICU Capacity April 20, 2020 – April 9, 2021. |
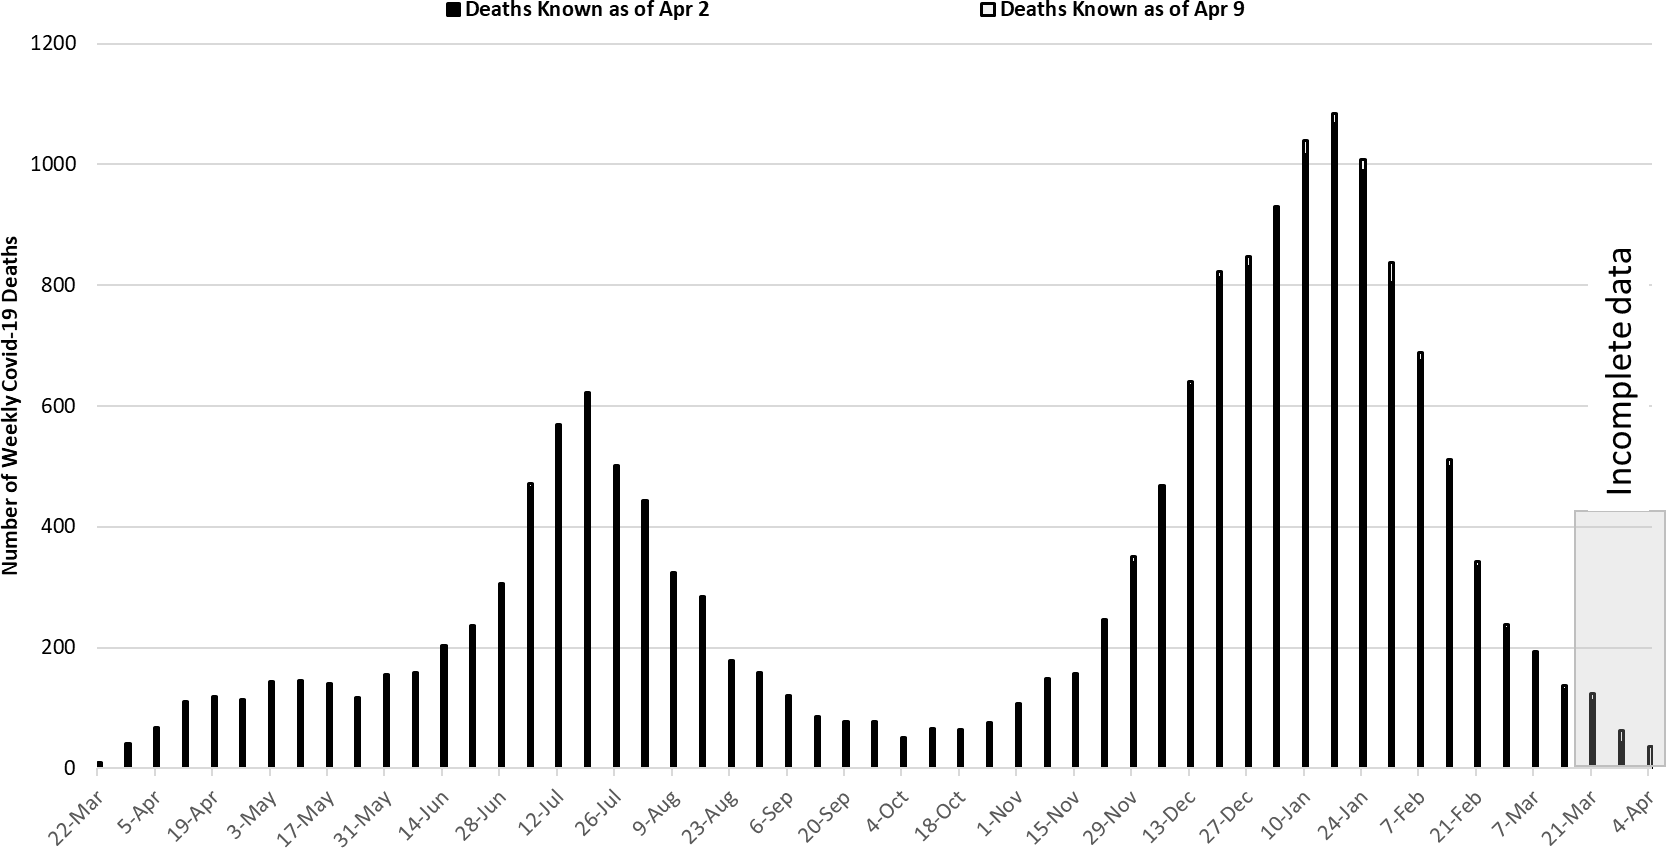
The week ending January 17th remains Arizona’s deadliest with 1084 deaths (Figure 7). Covid-19 deaths are expected to fall below 200 per week by the week ending March 14th.
|
Figure 7. Weekly Arizona Covid-19 Deaths March 1, 2020 – April 4, 2021. |
Pima County Outlook
For the week ending April 4th, 571 Pima County residents were diagnosed with Covid-19, essentially unchanged from the 568 cases initially reported last week (Figure 8). Last week’s initial tally was upwardly revised by 1% (7 cases) to 575 cases.
|
Figure 8. Covid-19 Cases and Individuals Undergoing Testing in Pima County Mar 1, 2020 – Apr 4, 2021. |
New cases are being diagnosed at a rate of 55 cases per 100K residents per week and are stable. For reference, October 9th marked a nadir between the summer and winter outbreak at 46 cases per 100K residents per week. Case rates reached their lowest post-holiday level at 43 cases per 100K residents per week on March 20th. Trends across the various age groups appear in Figure 9.
|
Figure 9. Covid-19 Cases by Age Group in Pima County from March 1, 2020 – April 4, 2021. |
Summary
- This week saw a small increase in Covid-19 cases and hospital occupancy. In many Arizona counties, absolute levels of SARS-CoV-2 viral transmission are once again above the 50 new cases per 100,000 residents per week threshold that distinguishes between substantial and moderate risk.
- As of April 4th, new cases were being diagnosed at a rate of 59 cases per 100,000 residents per week. This rate is neither increasing nor decreasing.
- While Arizona has one of the lowest viral transmission rates in the US according to the CDC, it remains the 6th hardest hit state overall.
- All unvaccinated residents should continue to wear a mask in public, avoid large social gatherings, maintain physical distance from non-household contacts, avoid >15 minutes contact in indoor spaces, especially if physical distancing is inadequate and adherence to face masks is low.
- Fully vaccinated residents (2 weeks post final dose) are now being afforded a greater freedom of movement and the ability to gather in small, low-risk groups, by the CDC.
- While residents and businesses should continue to follow the recommended public health mitigation efforts, normalization of lower risk activities is reasonable.
- The test positivity rate for traditional nasopharyngeal PCR testing is now <10% which is within the recommended 5 – 10% range for optimal public health practice.
- In some communities, absolute levels of transmission have reached levels that warrant a reconsideration of in-person instruction (see CDC Recommended Mitigation Strategies for K – 12 Learning Modes). Other communities have transmission rates below 50 cases per 100K residents per week which marks the threshold for in-person instruction by the CDC.
- Hospital Covid-19 occupancy is holding steady in the ward and ICU. Access to care however, remains somewhat restricted as the backlog of medically necessary non-Covid procedures is addressed.
- Arizona is now experiencing <200 Covid-19 deaths per week and this tally should fall below 100 deaths per week soon and then hold steady. The week ending January 17th will be Arizona’s deadliest with >1000 deaths. A new JAMA article indicates Arizona’s cumulative tally of Covid-19 deaths ranks it 4th in the nation behind only New York, New Jersey, and Mississippi. This is a one place higher than recorded by the CDC.
- According to the CDC, 26.4% of Arizona adults have received at least 2-doses of vaccine while another 16.7% have received 1-dose.
Priority Reading:
- Rubin R. COVID-19 Vaccines vs Variants – Determining How Much Immunity Is Enough. JAMA. 2021; 325(13):1241 – 42. (See link)
- Rubin R. Experts Discuss COVID-19 – Vaccine Questions, School Openings, and More. JAMA. 2021; 325(13):1244 – 45. (See link)
- Chapin-Bardales J, Gee J, Myers T. Reactogenicity Following Receipt of mRNA-Based COVID-19 Vaccines. JAMA. 2021: doi:10.1001/jama.2021.5374. (See link)
- Murray CJL, Plot P. The Potential Future of the COVID-19 Pandemic: Will SARS-CoV-2 Become a Recurrent Seasonal Infection? JAMA. 2021; 325(13):1249 – 50. (See link)levels.
Forecast reports to date, available as PDFs
Download PDF to view additional charts of Arizona counties, available in appendix of report.
April 9
2020 Reports
Based on what we know now about this pandemic, we support guidelines for social distancing to slow the spread of the virus and urge everyone to follow the recommendations provided by the Centers for Disease Control and Prevention (CDC) to protect yourself, your family, your neighbors, and your employees. Please heed the recommendations as provided by the CDC, found at the following website: https://www.cdc.gov/coronavirus/2019-ncov/prepare/prevention.html
COVID covid coronavirus virus covid19 corona forecast model

