


Note this forecast page is not the most recent forecast available.
View the most current forecast report
Researcher Analyzes Arizona COVID-19 Spread Models for Decision-Makers
The following information regarding the spread of COVID-19 in Arizona was prepared by Joe Gerald, MD, PhD, a researcher at the Mel and Enid Zuckerman College of Public Health (MEZCOPH) at the University of Arizona. This information has also been reviewed by other MEZCOPH faculty.
This data were obtained from the Arizona Department of Health Services COVID-19 webpage and reflect conditions in Arizona as of August 13, 2021.
This information is intended to help guide our response to the outbreak. It is not intended to predict how this pandemic will evolve. Rather, this model extrapolates what might occur if current conditions remain unchanged. As regional authorities and healthcare providers respond, their actions are expected to mitigate the worst consequences of this pandemic.

COVID-19 Disease Outbreak Forecast
Arizona State and Pima County
Updated August 13, 2021
Disclaimer: This information represents my personal views and not those of The University of Arizona, the Zuckerman College of Public Health, or any other government entity. Any opinions, forecasts, or recommendations should be considered in conjunction with other corroborating and conflicting data. Updates can be accessed at https://publichealth.arizona.edu/news/2021/covid-19-forecast-model.
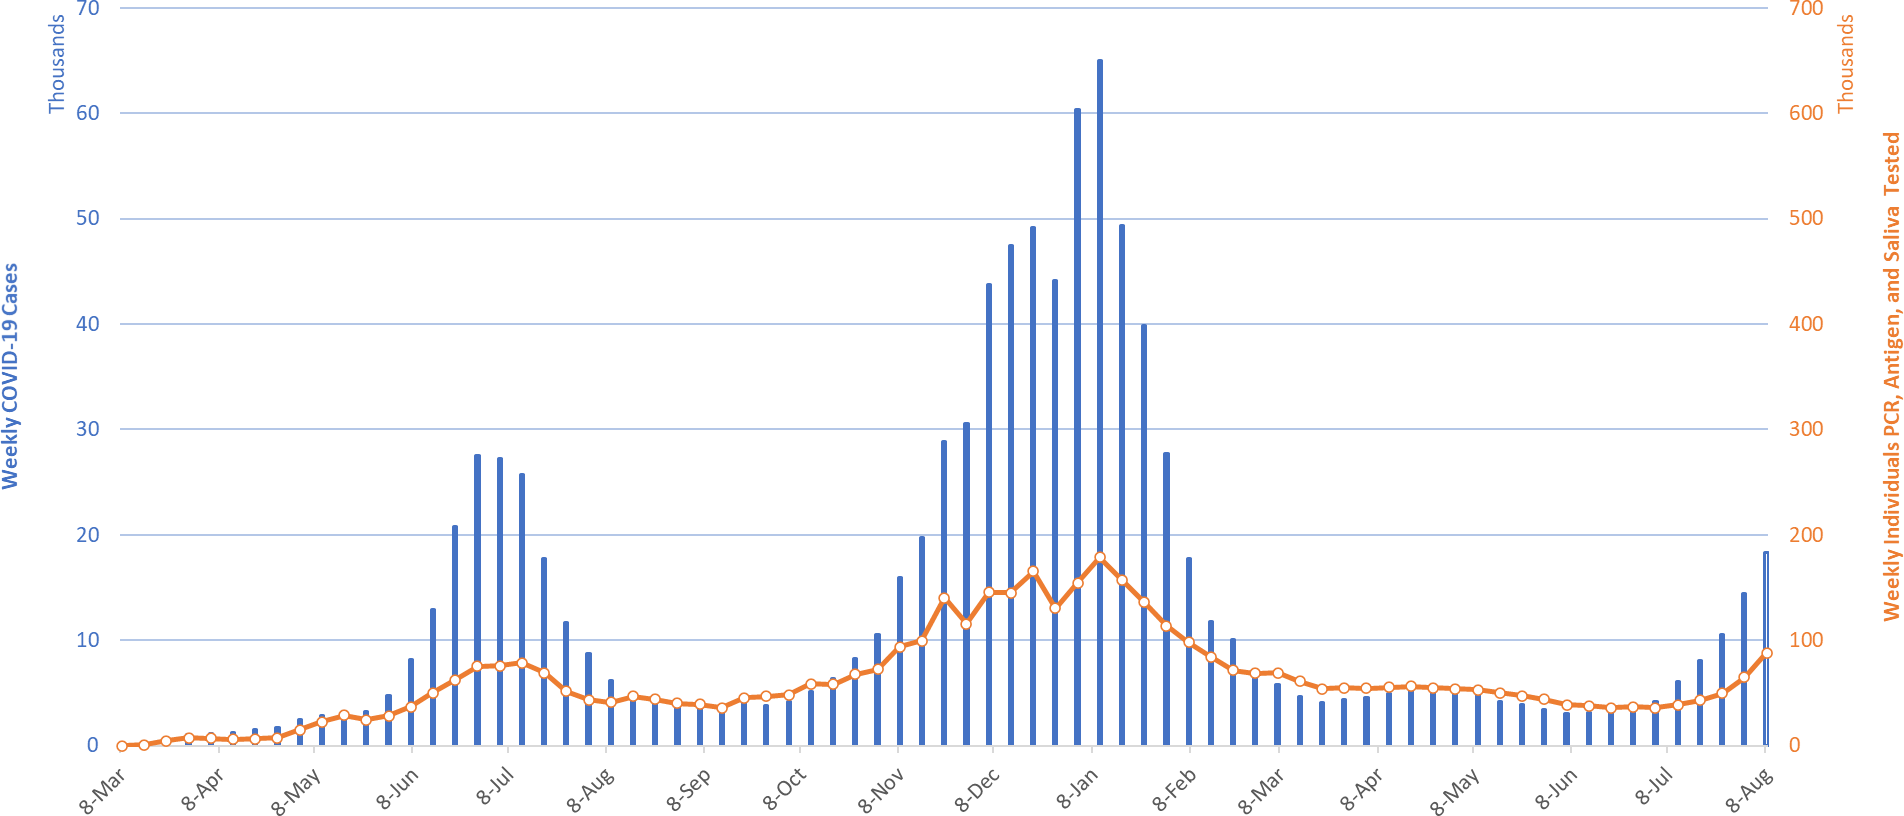
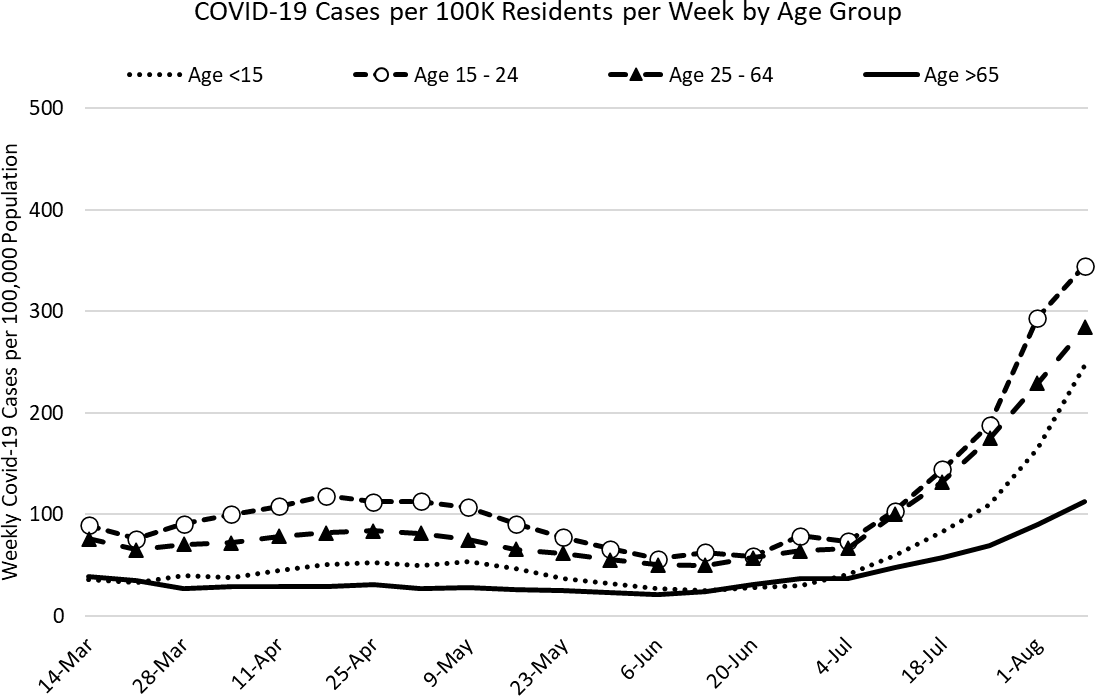
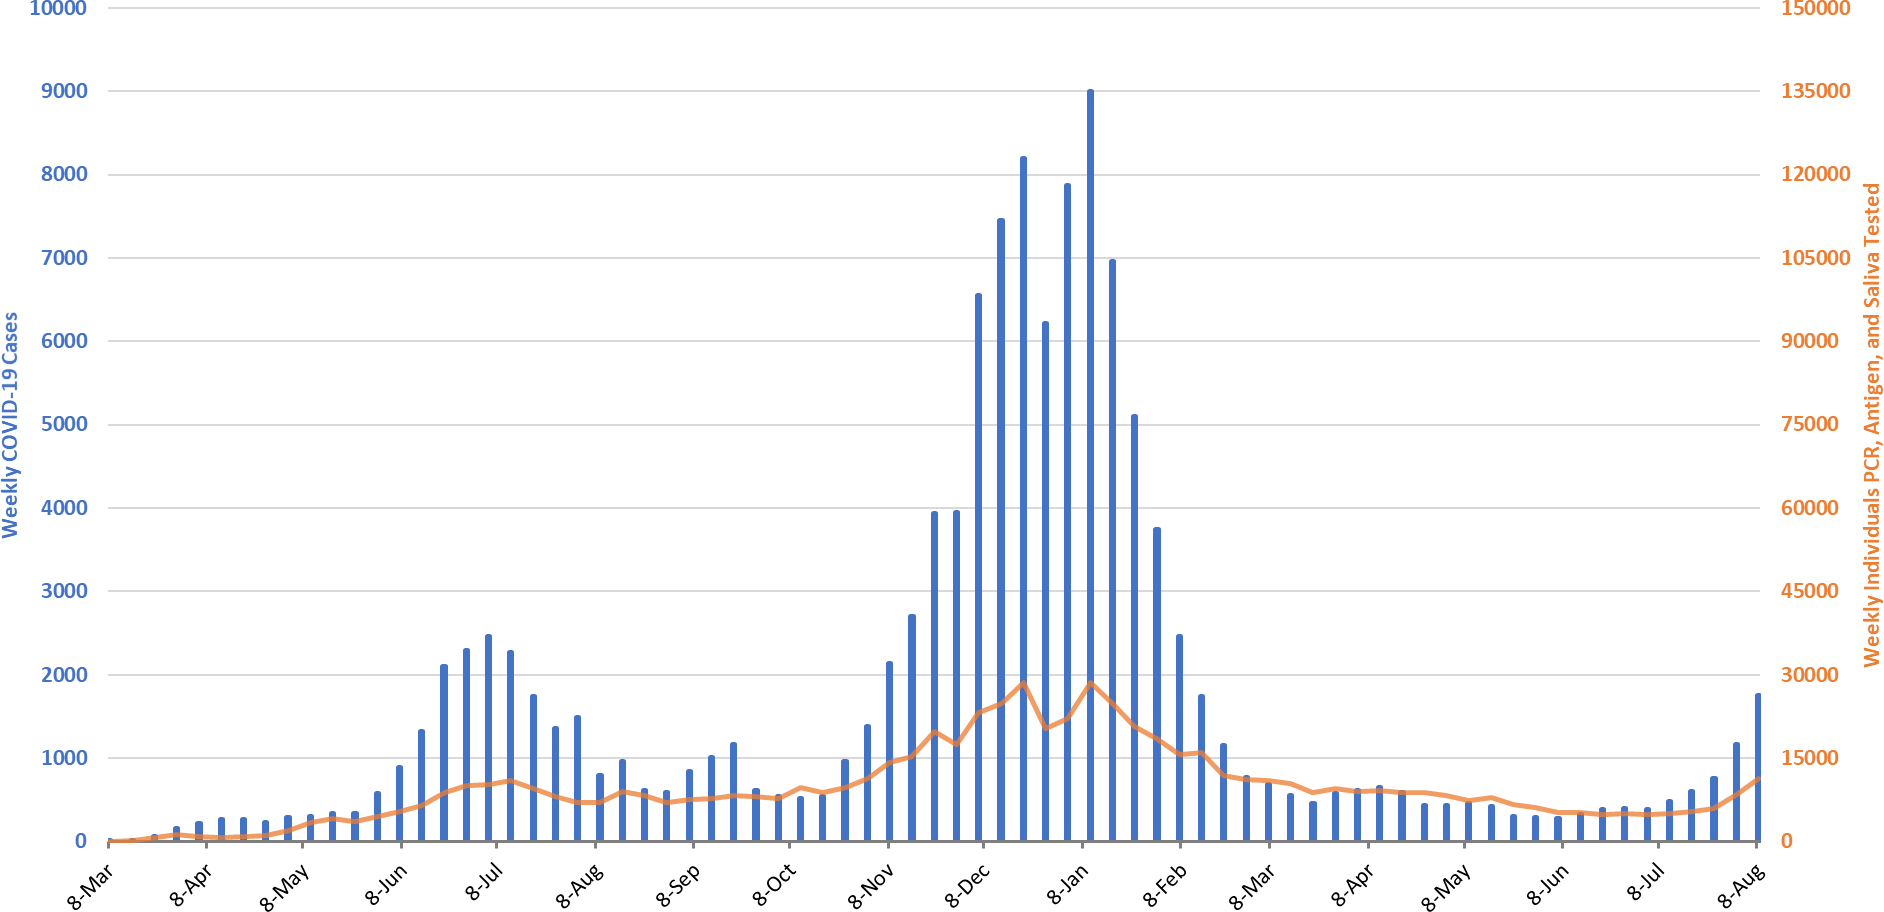
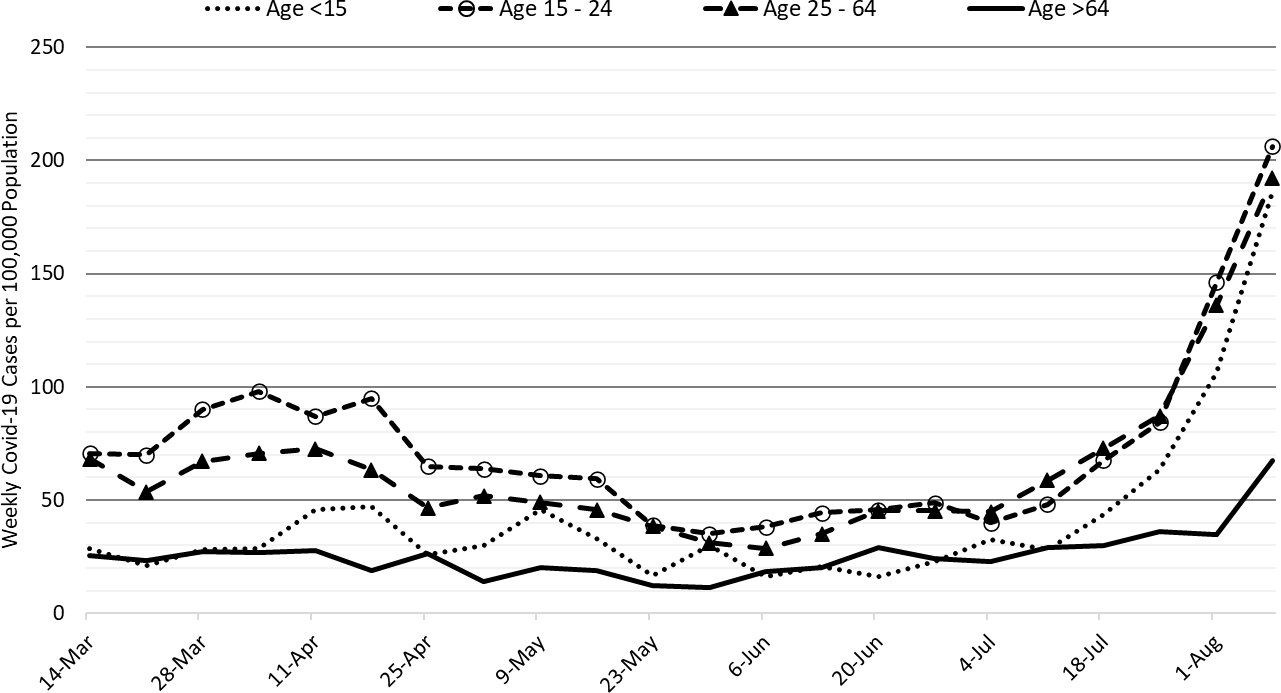
For the week ending August 8th, 18340 Arizonans were diagnosed with COVID-19, a 29% increase from last week’s initial tally of 14188 cases (Figure 1). This marks the 9th week of increasing rates with the last 5 being particularly brisk. The current rate, 255 cases per 100K residents per week, is increasing by 59 cases per 100K residents per week. While rates are 3X higher among those 15 – 24 years of age as compared to those ≥65 years of age, 345 versus 112 cases per 100K residents, respectively, transmission is increasing among all age groups (Figure 2a).
|
Figure 1. Newly Diagnosed Covid-19 Cases in Arizona and Number of Individuals Undergoing Covid-19 Diagnostic Testing March 1, 2020 through August 8, 2021. |
High levels of community transmission indicate we are now solidly amid another substantial surge in cases, hospitalizations, and deaths. The surge will likely exceed rates last seen during the summer of 2020 (409 cases per 100K residents). If Louisiana, Mississippi, Florida, Arkansas, and Alabama are any guide, it is possible that we could approach rates seen during the winter of 2021 (915 cases per 100K residents). Currently these 5 states have rates of 848, 773, 697, 527, and 502 cases per 100K residents per week, respectively. Several have exceeded their prior peaks, and ominously, their rates continue to rise.
According to the CDC, 56% of Arizona adults have received 2-doses of vaccine while another 10% have received 1-dose. While vaccinations have plateaued at about 90 thousand doses per week, vaccine outreach is still important. At this point, only individual and community non-pharmacologic interventions like mask mandates, limiting gathering sizes, and targeted business mitigations can stave off another substantial surge.
|
Figure 2a. Newly Diagnosed Covid-19 Cases in Arizona by Age Group March 7 – August 8, 2021. |
Resumption of in-person instruction in the face of high community transmission, low vaccination rates, prohibition of universal masking, lack of surveillance testing, and minimal physical distancing is leading to frequent school-related outbreaks and accelerating community transmission (as predicted). On a positive note, several school systems are challenging the governor’s inane and constitutionally circumspect prohibition of mask mandates. The state universities have also wisely chosen to ignore the order. While mask mandates are necessary, they will not be sufficient to slow transmission without other layered protections throughout the community.
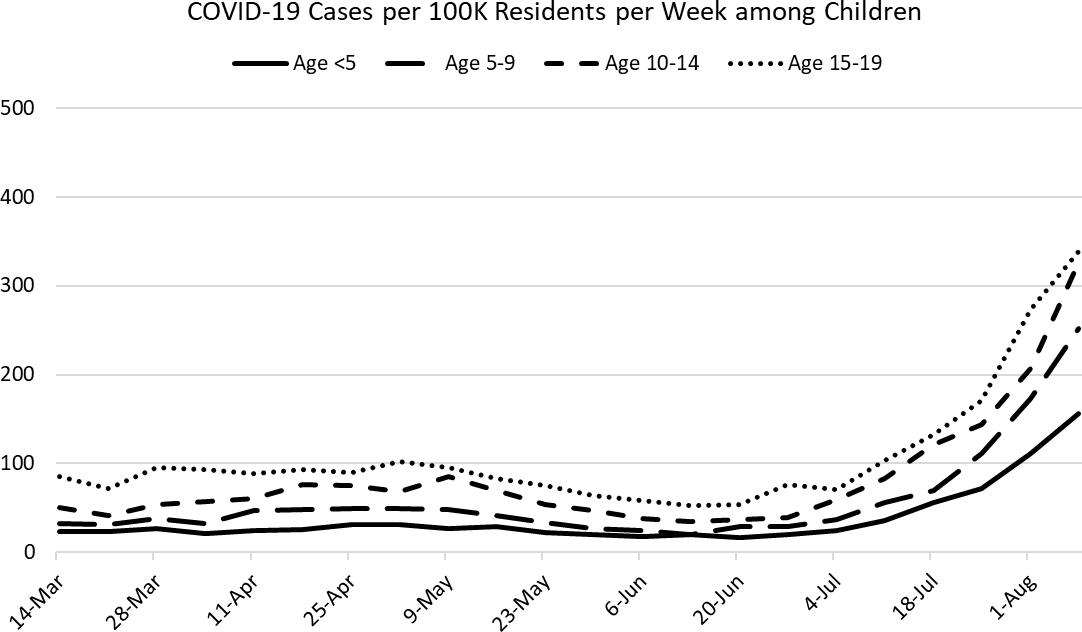
While difficult to appreciate, Figure 2a shows a new reversal of relative position between children (dotted) and older adults (solid). Historically, children 15 – 19 years of age have had rates approximating those of adults while prepubertal children have had meaningfully lower rates; however, rates among those age 5 – 9 years resemble those of their older counterparts in the presence of the Delta variant and the absence of effective non- pharmacologic measures (see CDC and the American Academy of Pediatrics recommendations; Figure 2b).
|
Figure 2b. Newly Diagnosed Covid-19 Cases in Arizona by Age Group March 7 – August 8, 2021. |
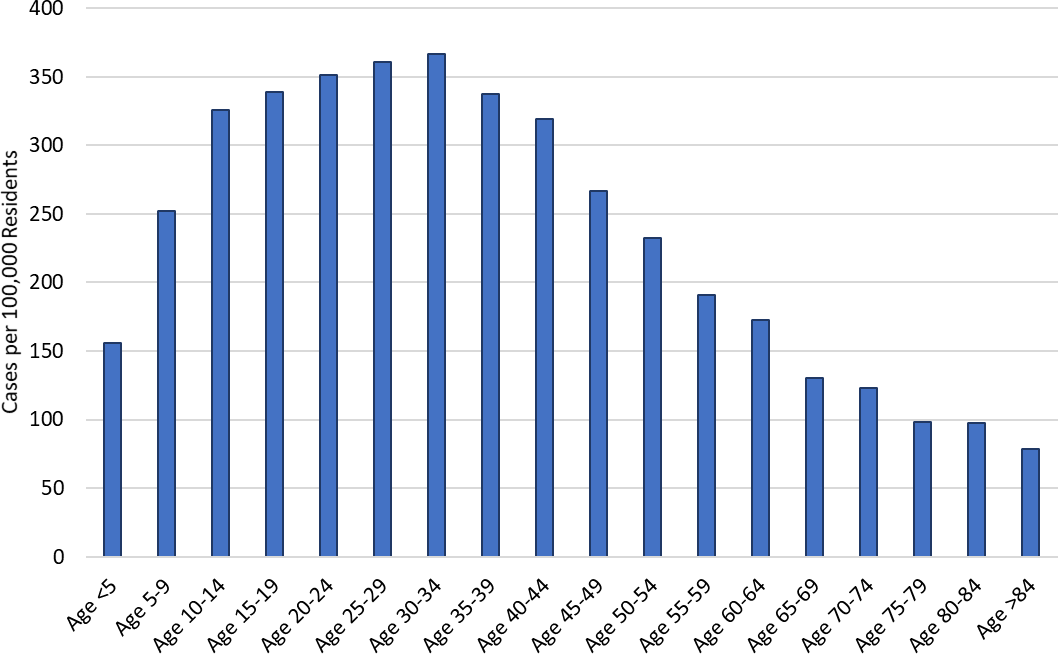
While considerable attention is being given to childhood cases, it is important to reaffirm that this outbreak, like past outbreaks, is being driven by transmission among adolescents and working-age adults in the community (Figure 2c). If our goal is to protect children, the most effective way to accomplish it is to slow transmission among adults. In certain respects, the current focus on K-12 re-opening is scapegoating children for adult misbehavior.
|
Figure 2c. Weekly COVID-19 Incidence by Age Group August 1 - 8, 2021. |
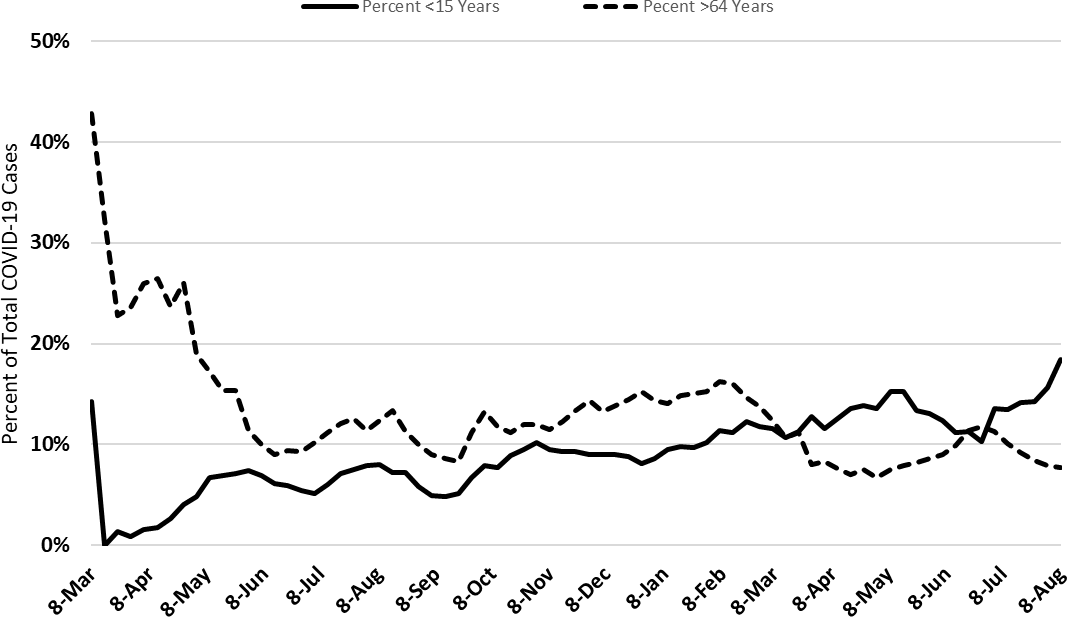
Vaccination has only modestly shifted the age distribution of cases with children “switching” relative position with older adults (Figure 2d). Children now represent about 18% of cases, up from 10% during the winter 2020 outbreak, while older adults now represent about 8% of cases, down from 15% during the winter 2020 outbreak.
|
Figure 2d. Percent of COVID-19 Cases Attributable to Children and Older Adults March 1 – August 8, 2021. |
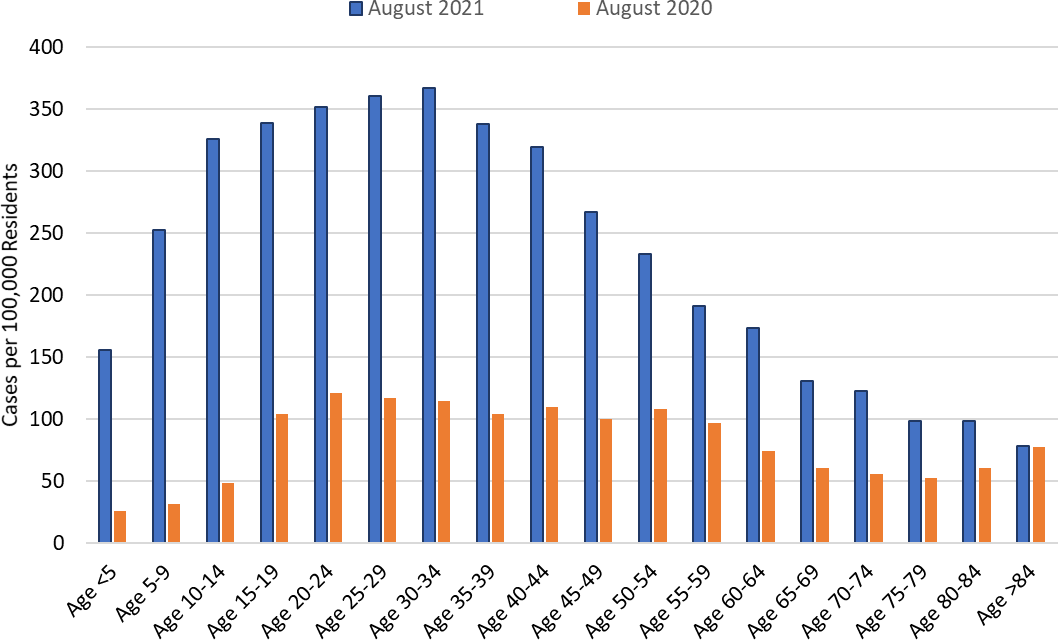
To create a mental frame, it is helpful to compare our current circumstance to those we have previously experienced. Comparing school reopening this year (in-person) with last (virtual), levels of community transmission are much higher this year (Figure 2e). The availability of effective vaccines combined with an early summer reprieve provided a false sense of security that the Delta variant has now shattered. We relaxed our mitigation efforts too quickly and have been too slow to reinstitute them. Hundreds, if not thousands, of Arizonans will now pay the ultimate price for this hubris.
|
Figure 2e. COVID-19 Cases by Age Group, First Week August 2020 versus August 2021. |
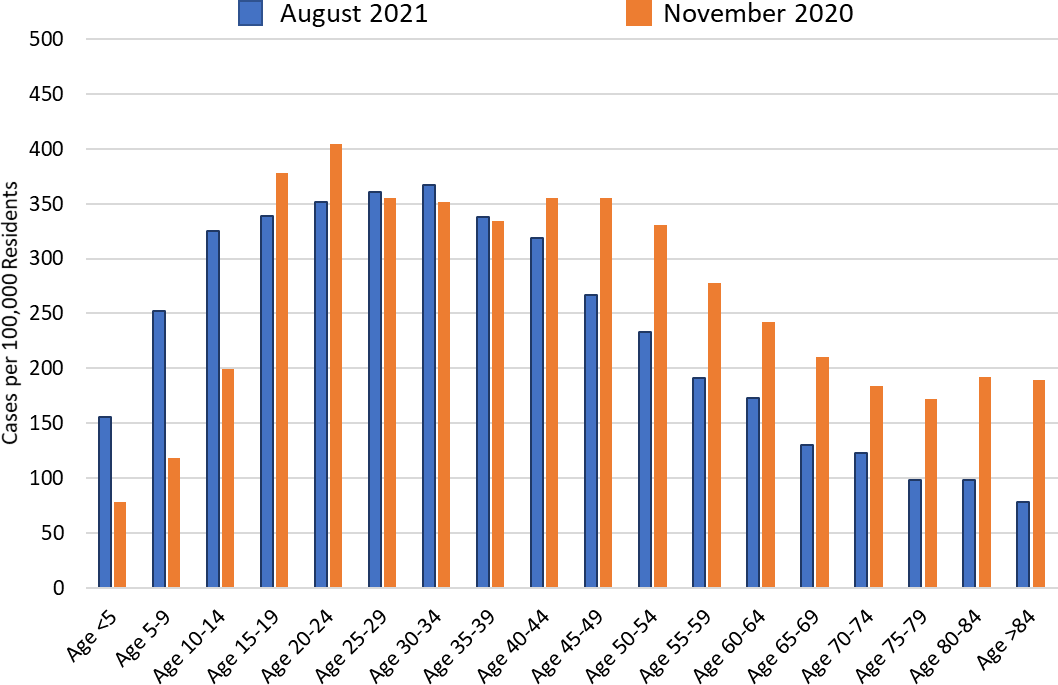
By comparing two different time periods with similar levels of transmission (August 8, 2021 and November 15, 2020), a shift towards younger age at time of diagnosis becomes apparent (Figure 2f). The most striking increases have occurred among those <15 years of age; the most striking declines have occurred among those >40 years of age. Even so, hospital occupancy is similar between the two time periods suggesting the Delta variant may be more likely to cause severe illness. Is sum, we should prepare for the worst while we hope for the best.
|
Figure 2f. COVID-19 Cases by Age Group, August 8, 2021 (255 cases per 100K residents) versus November 15, 2020 (275 cases per 100K residents). |
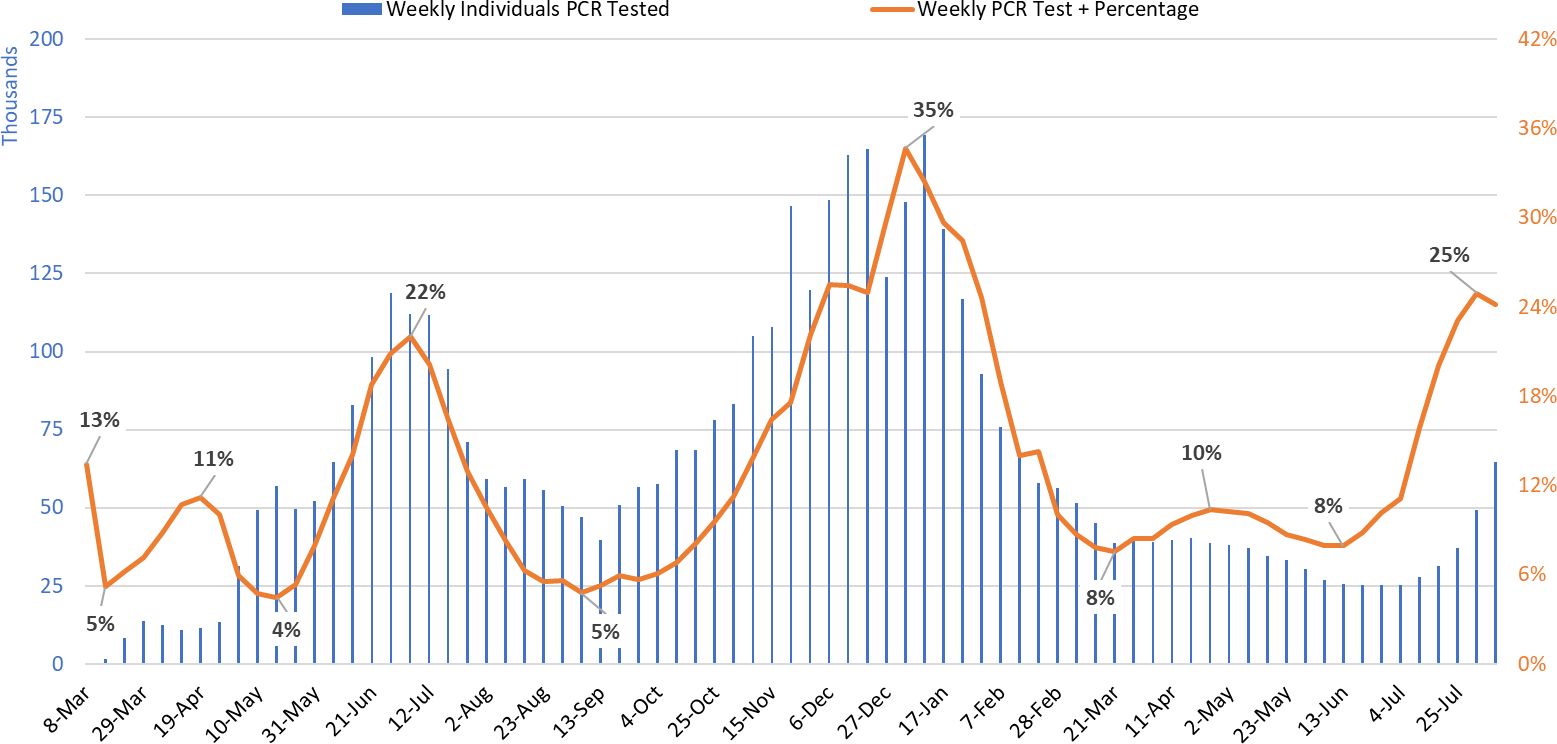
Test positivity among those undergoing traditional nasopharyngeal PCR testing held steady this week at 25% (Figure 3). This level indicates testing is inadequate for optimal public health practice and means many cases are going undiagnosed.
|
Figure 3. Weekly Number Patients Undergoing Traditional Nasopharyngeal PCR Testing and Associated Percent Positivity March 1, 2020 – August 8, 2021. |
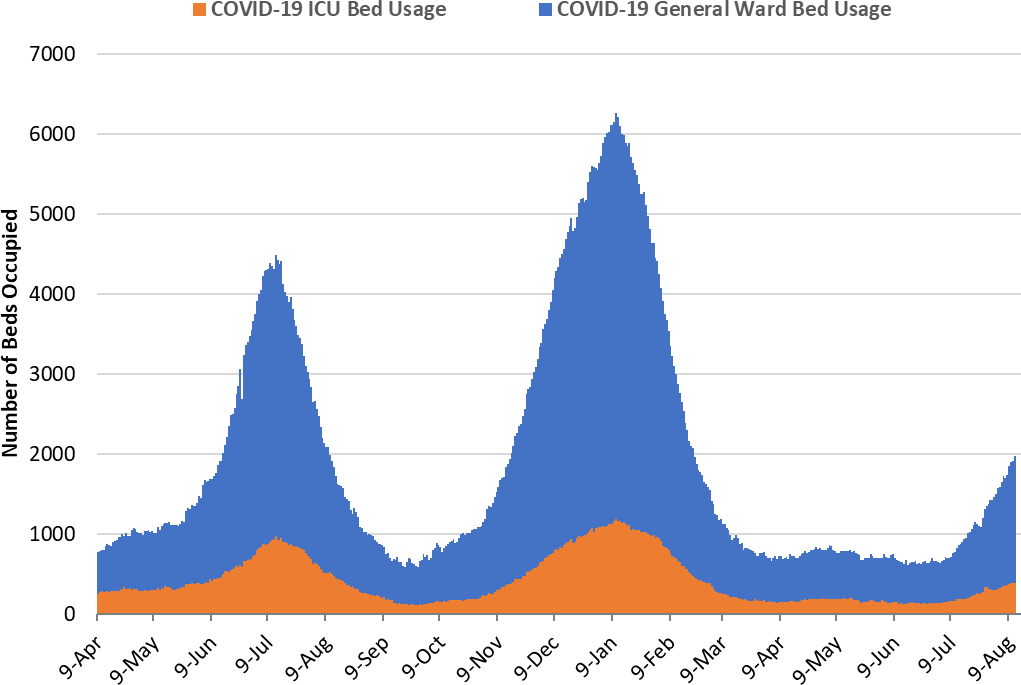
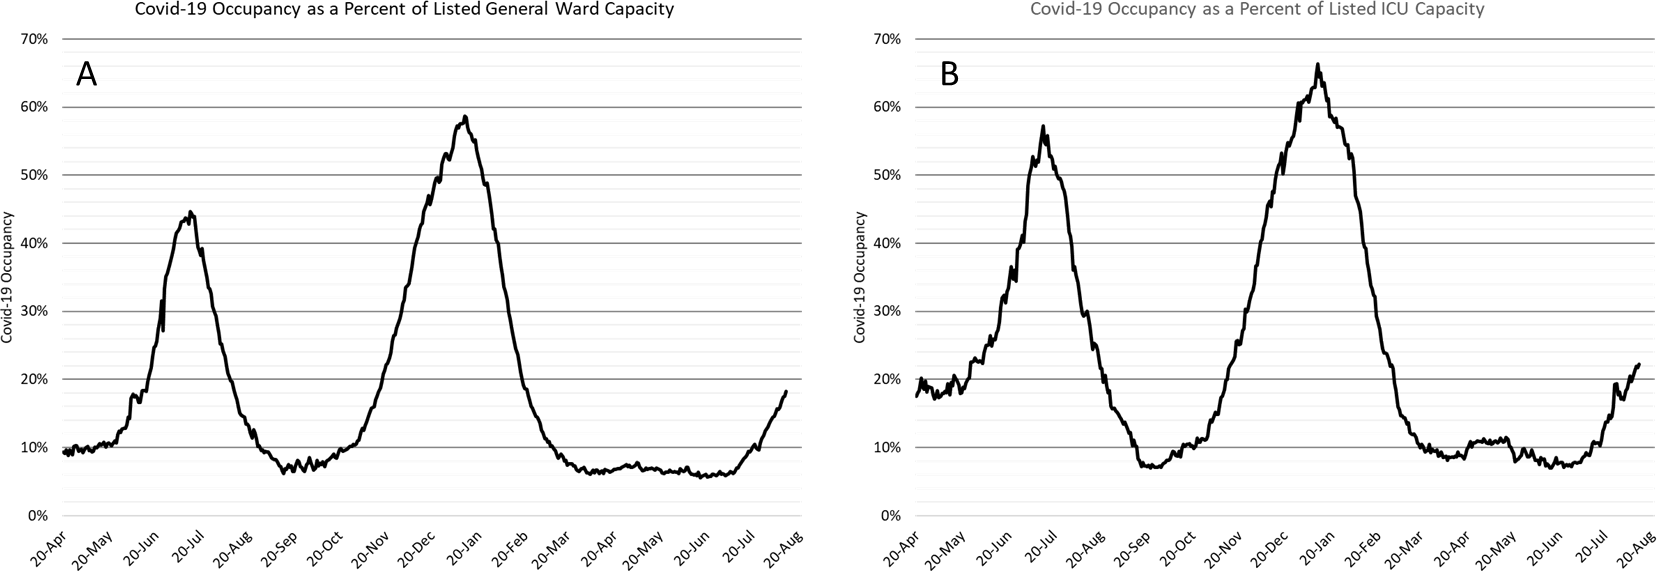
As of Aug 11th, 1527 (18%) of Arizona’s 8707 general ward beds were occupied by Covid-19 patients, a 21% increase from the previous week’s 1266 occupied beds (Figure 4 and Figure 5 Panel A). Another 797 (9%) beds remained available for use. The number of available beds is lower than the previous week’s 887 beds.
|
Figure 4. Arizona Daily Covid-19 General Ward and ICU Census April 9, 2020 – August 11, 2021. |
As of August 11th, 383 (22%) of Arizona’s 1722 ICU beds were occupied with Covid-19 patients, a 19% increase from the prior week’s count of 321 patients (Figure 4 and Figure 5 Panel B). An additional 174 (10%) ICU beds remained available for use, about the same as last week’s 175 beds.
|
Figure 5. Covid-19 Occupancy as a Percent of Listed General Ward (A, left) and ICU (B, right) Capacity in Arizona April 20, 2020 – August 11, 2021. |
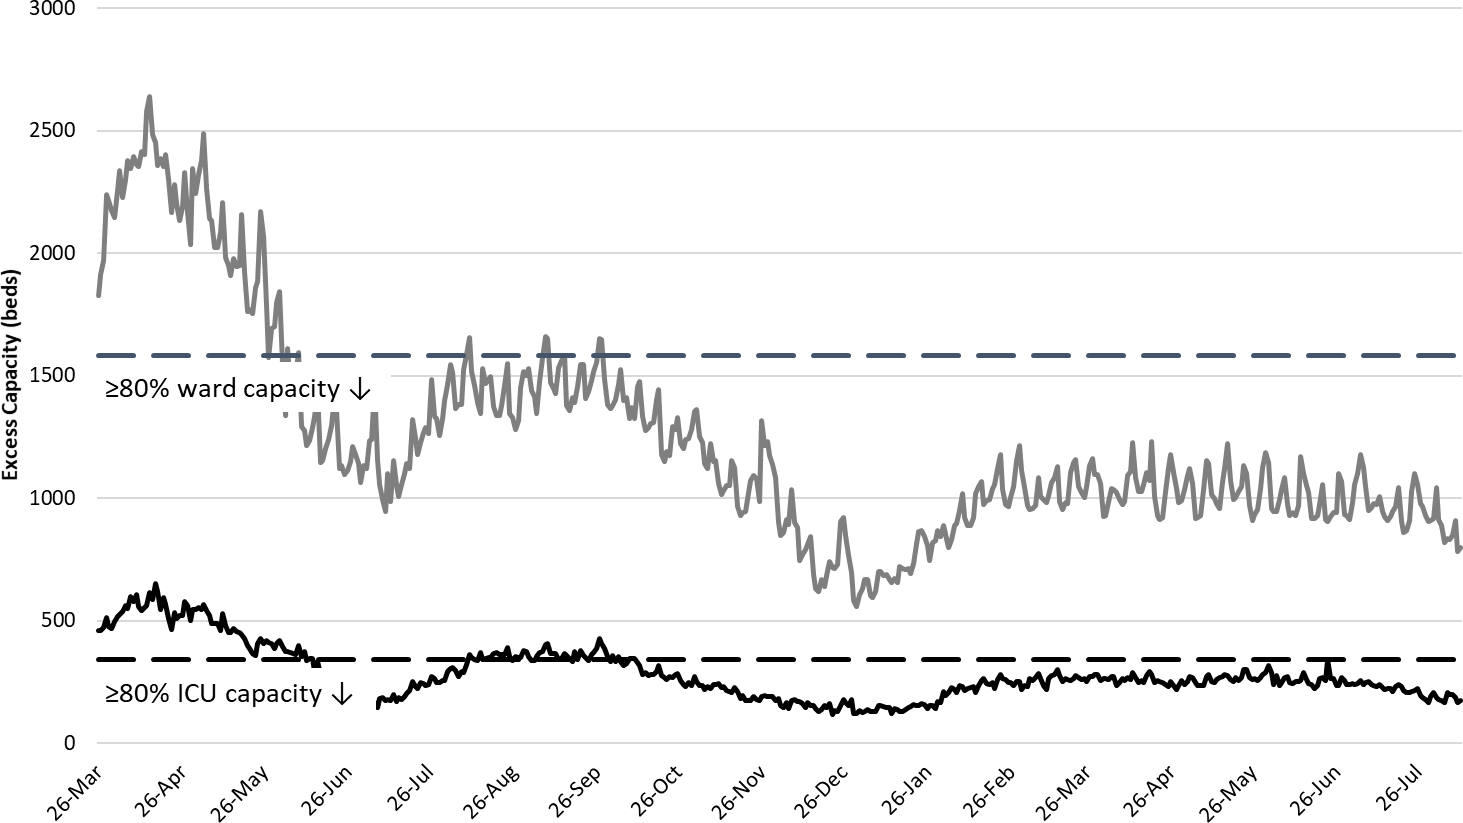
Arizona hospital occupancy remains above seasonal levels and we are now seeing the first indications that our safety margin as measured by excess, available ward and ICU beds is eroding (Figure 6). Undoubtedly, some medically necessary procedures will likely be postponed and rescheduled over the coming weeks to make room for critically ill COVID-19 patients. Hospitals should be prepared for >20% COVID-19 ward occupancy and >25% ICU occupancy for the foreseeable future. Even if you are vaccinated, the COVID-19 surge can impact your health should you become ill and required hospital care. In the essence, care will become increasingly more rationed over the coming weeks with only the sickest of the sick being able to access critical care services.
|
Figure 6. Observed Excess Non-Surge General Ward and ICU Capacity March 26, 2020 – August 11, 2021. |
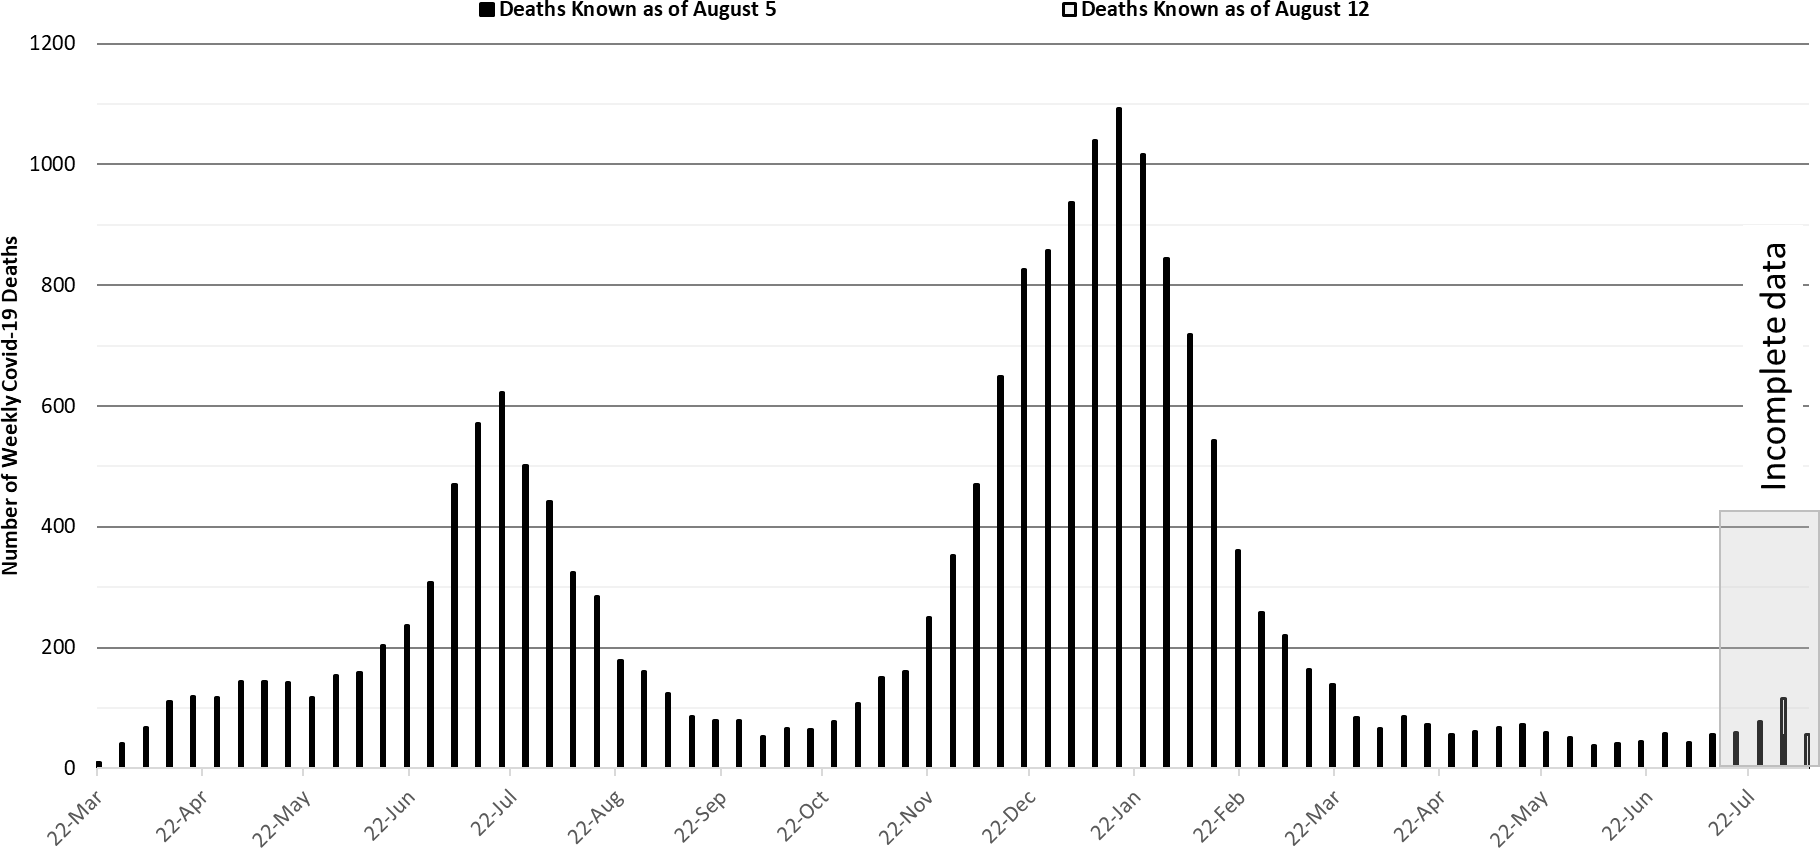
While the week ending January 17, 2021 remains Arizona’s deadliest with 1093 deaths, we are once again seeing >100 COVID-19 deaths per week. The week ending August 1st tallied 115 deaths so far with more likely to be recorded in the coming weeks. With a case fatality rate of about 1.5%, this week’s tally of 18340 cases will result in approximately 300 deaths per week by the end of August. There is nothing we can do about these deaths; they are already on the books we just don’t know it yet. Our work over the coming weeks is to prevent these 300 weekly deaths from becoming 500 or more.
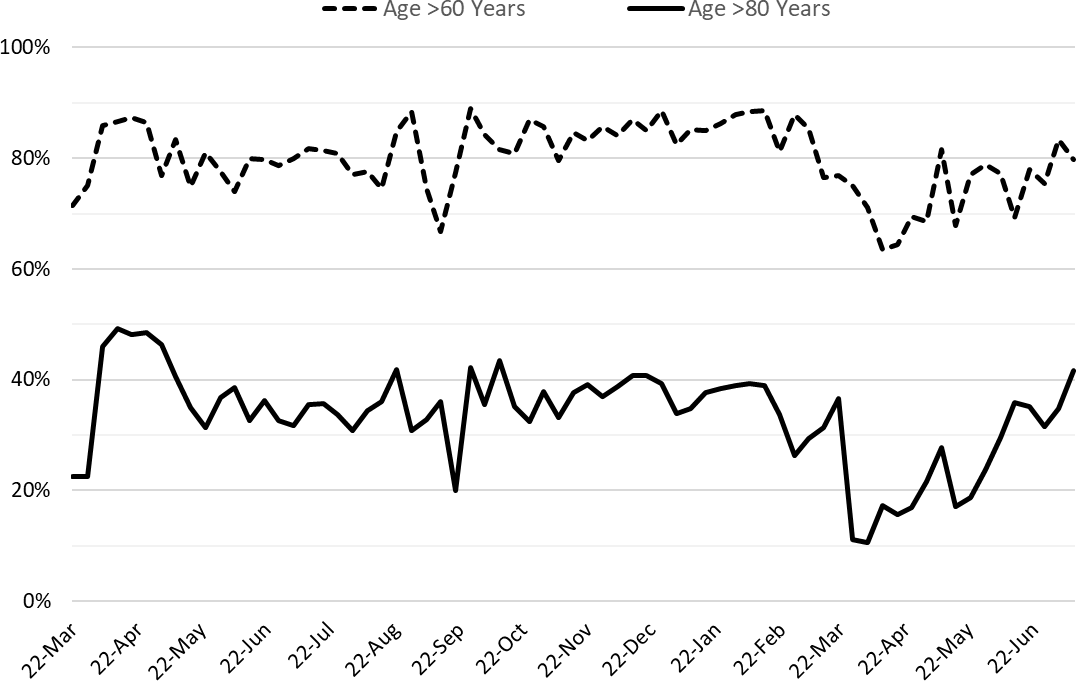
Despite high vaccination rates among those >65 years of age, most deaths are still attributable to infections among this medically frail group (Figure 7b).
|
Figure 7a. Weekly Arizona Covid-19 Deaths March 16, 2020 – August 8, 2021. |
|
Figure 7b. Percent of COVID-19 Deaths Attributable to Those >65 Years and >80 Years, March 16, 2020 – June 27, 2021. |
Pima County Outlook
For the week ending August 8th, 1762 Pima County residents were diagnosed with Covid-19 (Figure 8). This is a 53% increase from the 1151 cases initially reported last week.
|
Figure 8. Covid-19 Cases and Individuals Undergoing Testing in Pima County Mar 1, 2020 – August 8, 2021. |
New cases are being diagnosed at a rate of 168 cases per 100K residents per week. This rate is increasing by 56 cases per 100K residents per week. Trends across the various age groups appear in Figure 9 (Note: cases among <15 years approximate adults).
|
Figure 9. Figure 11. Covid-19 Cases by Age Group in Pima County from March 14 – August 8, 2021. |
Summary
- Arizona is experiencing high and rapidly increasing levels of community transmission that will be sustained to create another surge of cases and hospitalizations as big as the summer of 2020. While I am hopeful we will not reach the levels seen in the winter of 2021, the experience of other states (e.g., Louisiana) combined with inaction of our local and state officials suggests this may be wishful thinking.
- As of August 8th, new cases were being diagnosed at a rate of 255 cases per 100,000 residents per week. The rate was increasing at 59 cases per 100,000 residents per week. Another wave of cases and hospitalizations caused by the Delta variant is now certain; the only question remaining is just how big.
- Vaccination remains the most important public health priority to reduce viral transmission and severe illness over the long-term; however, in the short-term only mask mandates, restrictions on indoor gatherings in public settings, and targeted business restrictions will reduce transmission we are now experiencing.
- Resumption of in-person instruction in K – 12 schools now, and universities in the coming weeks, will lead to frequent school-associated outbreaks and contribute to accelerating community transmission. Vaccine and mask mandates along with weekly surveillance testing, adequate ventilation, and physical distancing is required to stave-off a worst-case scenario in schools.
- Hospital COVID-19 occupancy is increasing and is likely to exceed 20% of all beds in the general ward and 25% of beds in the ICU for many weeks. Access to care is becoming more restricted as COVID-19 occupancy is increasing. Expect delays in elective procedures to once again mount.
- There is no evidence that existing vaccination levels will meaningfully blunt the impact of community transmission on hospitals. Hospitals should (and likely are) prepare for another meaningful surge that will strain staffing in critical care areas and lead to critical shortages.
- Arizona is now experiencing >100 deaths per week. This amount will increase in the coming weeks and will almost certainly reach 300 per week by the end of August.
- According to the CDC, 56% of Arizona adults have received at least 2-doses of vaccine while another 10% have received 1-dose. In the face of the Delta variant, this is wholly insufficient.
- Despite evidence of limited immune escape to the Delta variant, especially before completion of the full vaccination sequence, vaccination continues to provide extraordinarily high levels of protection from severe illness.
- The CDC revised its mask guidance for vaccinated individuals in part due to a large outbreak in Massachusetts where the majority of cases was among fully vaccinated residents. Fully vaccinated individuals should mask when indoors in public spaces where community transmission is high or substantial. If exposed to a known case, individuals should be tested in 3 – 5 days regardless of symptoms and wear a mask for 14 days post-exposure.
Forecast reports to date, available as PDFs
Download PDF to view additional charts of Arizona counties, available in appendix of report.
2020 Reports
Based on what we know now about this pandemic, we support guidelines for social distancing to slow the spread of the virus and urge everyone to follow the recommendations provided by the Centers for Disease Control and Prevention (CDC) to protect yourself, your family, your neighbors, and your employees. Please heed the recommendations as provided by the CDC.
COVID covid coronavirus virus covid19 corona forecast model

