


Note this forecast page is not the most recent forecast available.
View the most current forecast report
Researcher Analyzes Arizona COVID-19 Spread Models for Decision-Makers
The following information regarding the spread of COVID-19 in Arizona was prepared by Joe Gerald, MD, PhD, a researcher at the Mel and Enid Zuckerman College of Public Health (MEZCOPH) at the University of Arizona. This information has also been reviewed by other MEZCOPH faculty.
This data were obtained from the Arizona Department of Health Services COVID-19 webpage and reflect conditions in Arizona as of August 20, 2021.
This information is intended to help guide our response to the outbreak. It is not intended to predict how this pandemic will evolve. Rather, this model extrapolates what might occur if current conditions remain unchanged. As regional authorities and healthcare providers respond, their actions are expected to mitigate the worst consequences of this pandemic.

COVID-19 Disease Outbreak Forecast
Arizona State and Pima County
Updated August 20, 2021
Disclaimer: This information represents my personal views and not those of The University of Arizona, the Zuckerman College of Public Health, or any other government entity. Any opinions, forecasts, or recommendations should be considered in conjunction with other corroborating and conflicting data. Updates can be accessed at https://publichealth.arizona.edu/news/2021/covid-19-forecast-model.
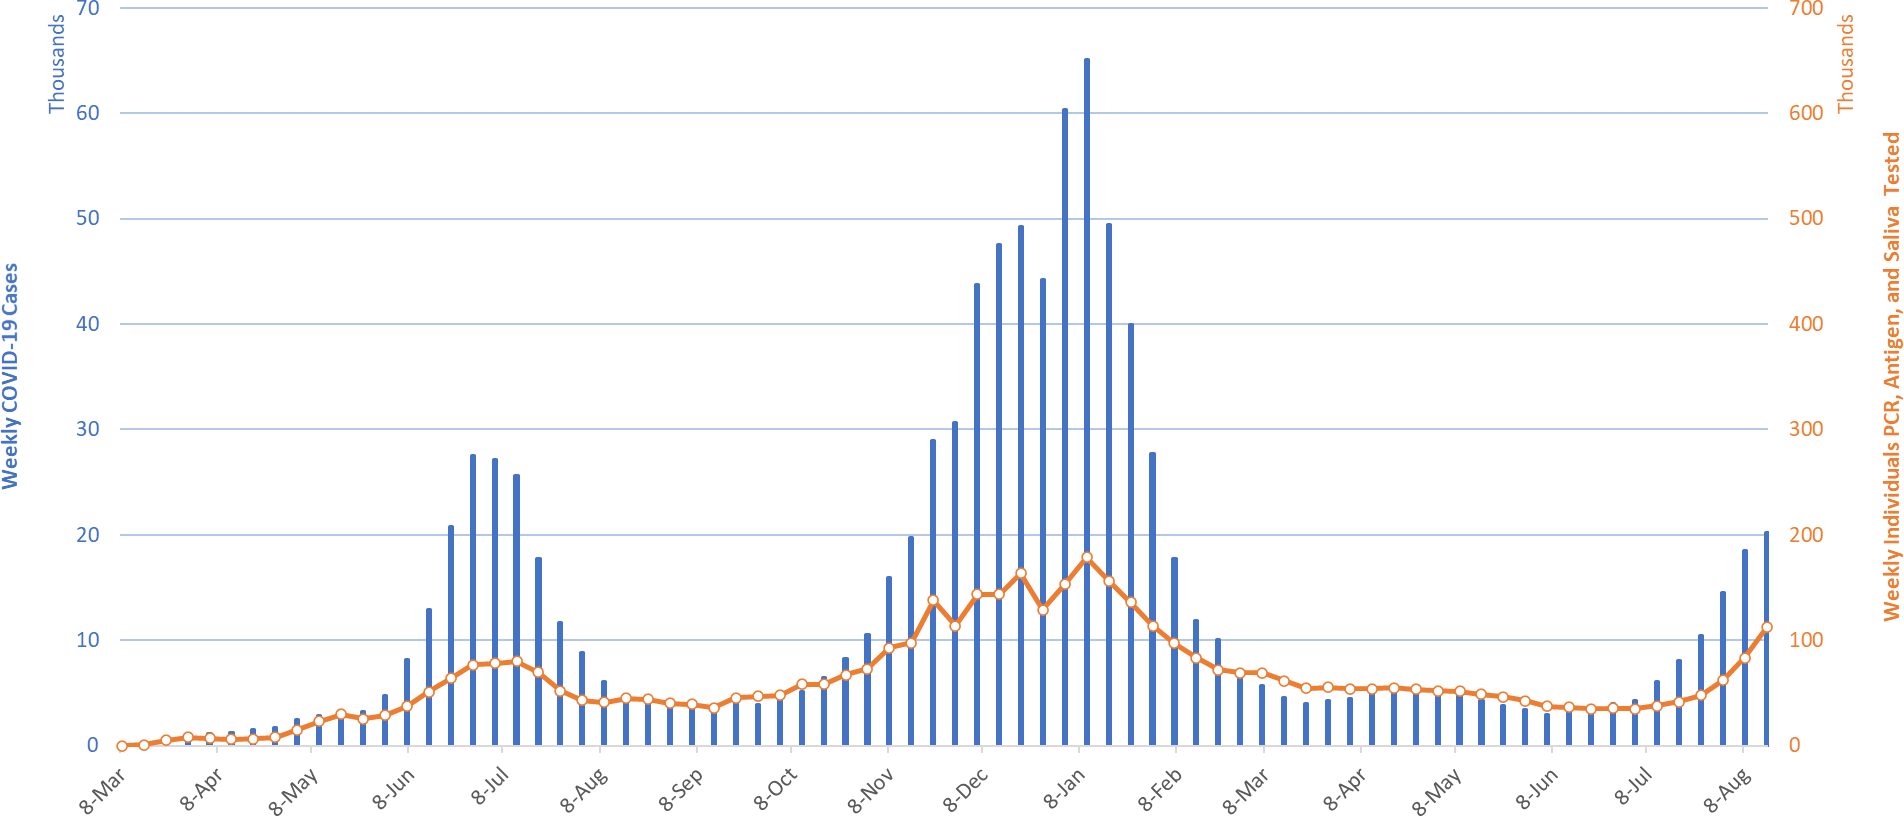
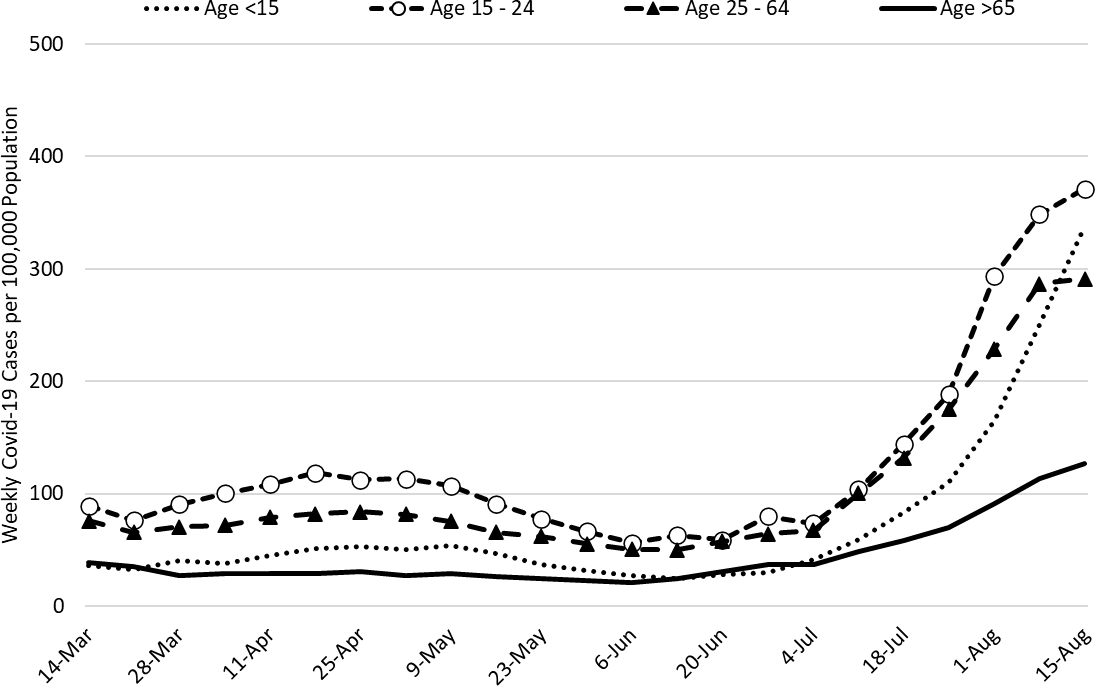
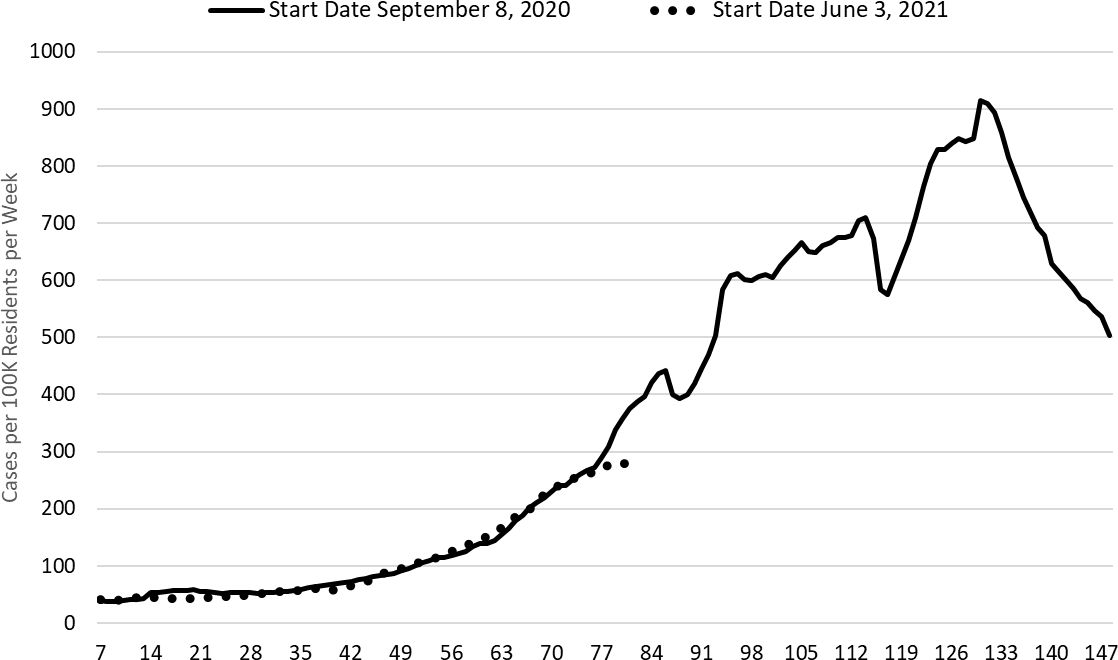
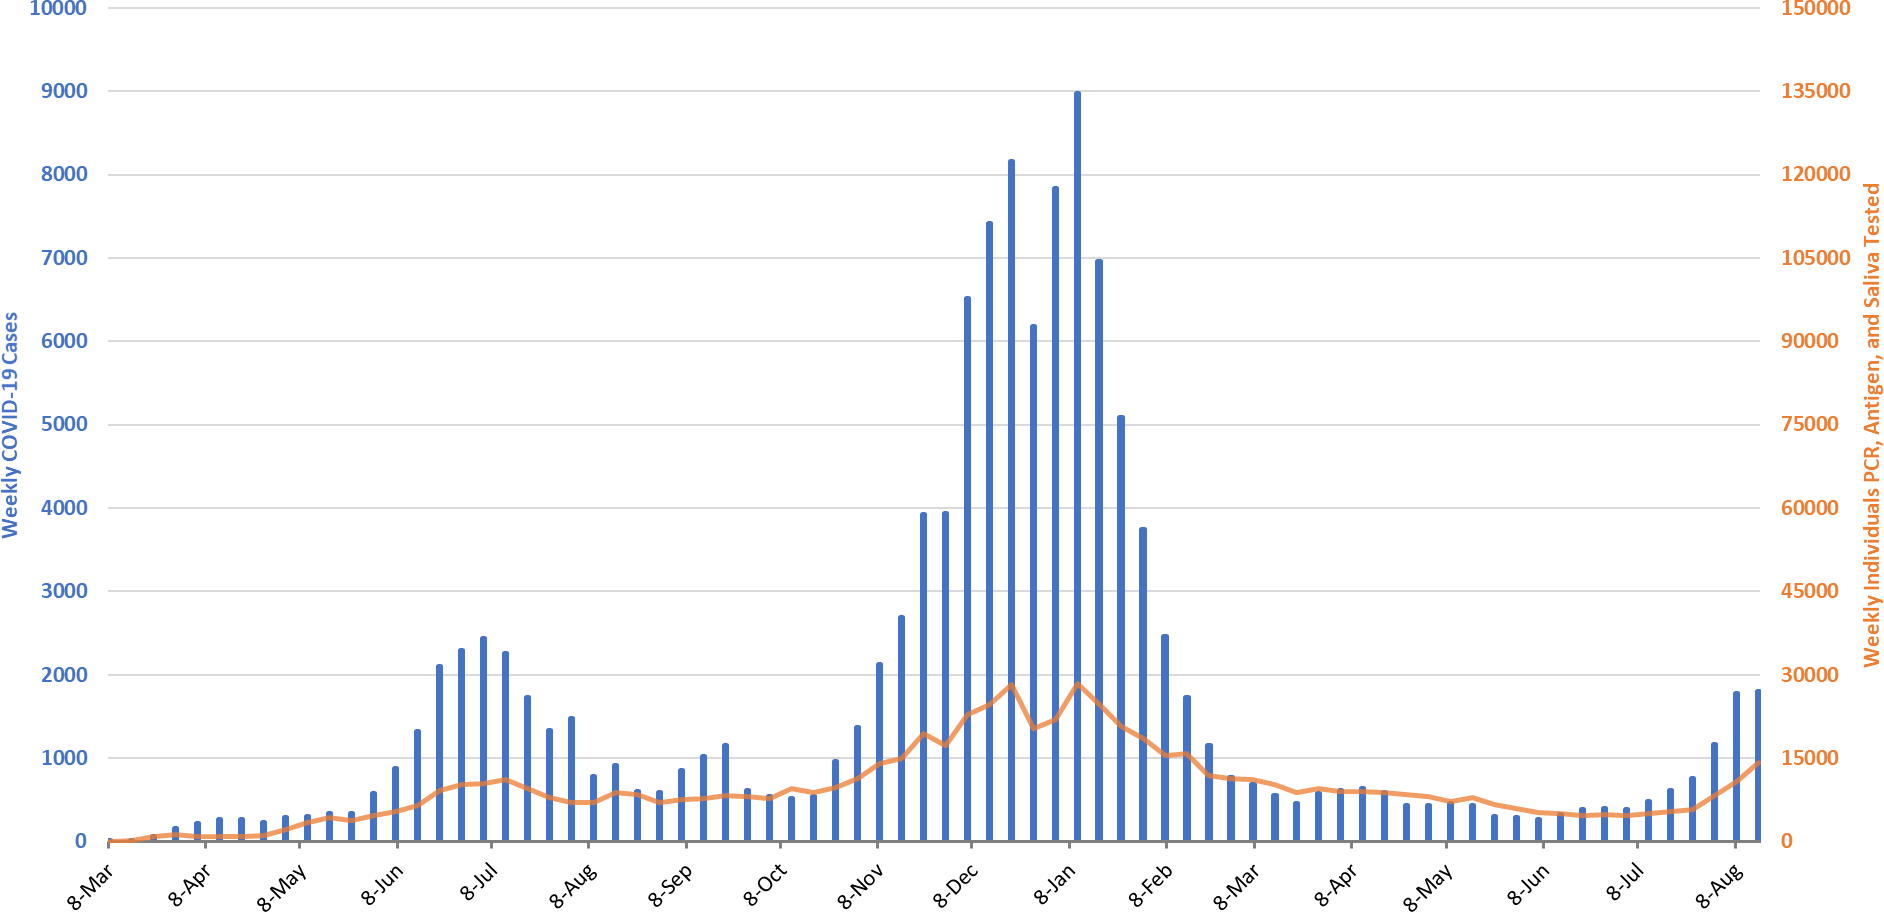
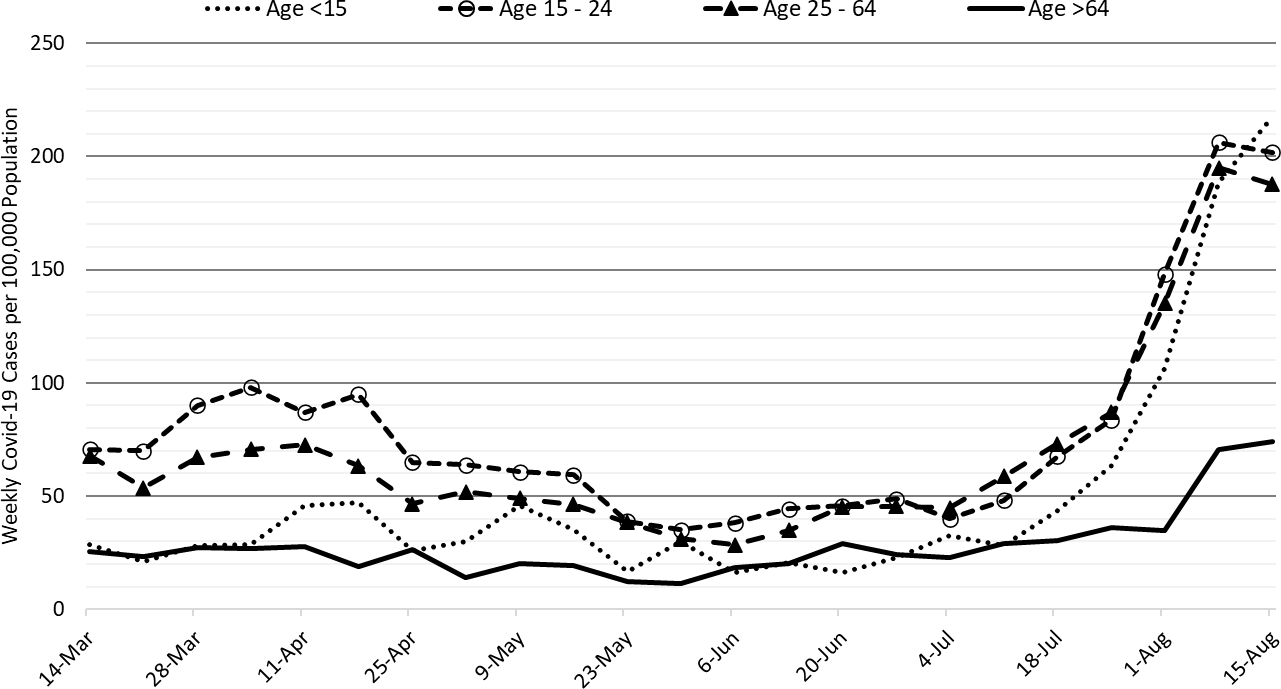
For the week ending August 15th, 20260 Arizonans were diagnosed with COVID-19, a 10% increase from last week’s initial tally of 18340 cases (Figure 1). This marks the 10th week of increasing rates but the outbreak’s first potential moderation. The current rate, 278 cases per 100K residents per week, is increasing by 24 cases per 100K residents per week which is half of last week’s rate, 59 cases per 100K residents. Case rates remain 3X higher among those 15 – 24 years of age as compared to those ≥65 years of age, 371 versus 127 cases per 100K residents, respectively. For the first time, transmission among those <15 years is posed to surpass all other age groups (Figure 2a).
|
Figure 1. Newly Diagnosed Covid-19 Cases in Arizona and Number of Individuals Undergoing Covid-19 Diagnostic Testing March 1, 2020 through August 15, 2021. |
Arizona is now solidly amid another substantial surge in cases, hospitalizations, and deaths. If sustained, the surge could exceed rates last seen during the summer of 2020, 409 cases per 100K residents per week. Except for Mississippi, 4-of-the-5 other states with the highest transmission rates now have stable or declining rates. Current rates for Mississippi, Louisiana, Florida, Arkansas, and Alabama are 843, 785, 664, 488, and 422 cases per 100K residents per week, respectively. Arizona’s level of transmission now ranks 22nd among the 50 states.
According to the CDC, 57% of Arizona adults have received 2-doses of vaccine while another 10% have received 1-dose. While vaccinations have plateaued at 90 thousand doses per week, vaccine outreach remains important. Individual and community non-pharmacologic interventions like mask mandates, limiting gathering sizes, and targeted business mitigations are still needed to ensure this surge doesn’t intensify.
|
Figure 2a. Newly Diagnosed Covid-19 Cases in Arizona by Age Group March 7 – August 15, 2021. |
Resumption of in-person instruction in the face of high community transmission, low vaccination rates, prohibition of universal masking, lack of surveillance testing, and minimal physical distancing is leading to frequent school-related outbreaks and has the potential to accelerate community transmission. On a positive note, several K – 12 and university systems are challenging the governor’s prohibition of mask mandates.
Figure 2a above shows that transmission among children (dotted) is poised to surpass the rates of older age groups for the first time in pandemic history. The combination of increased transmissibility (Delta variant), resumption of in-person K – 12 instruction, and prohibition of effective non-pharmacologic measures (e.g., masking and testing) is causing transmission among children 5 – 14 years to accelerate (Figure 2b). In coming weeks, case rates are expected to increase among those 15 – 24 years as universities also re-open.
|
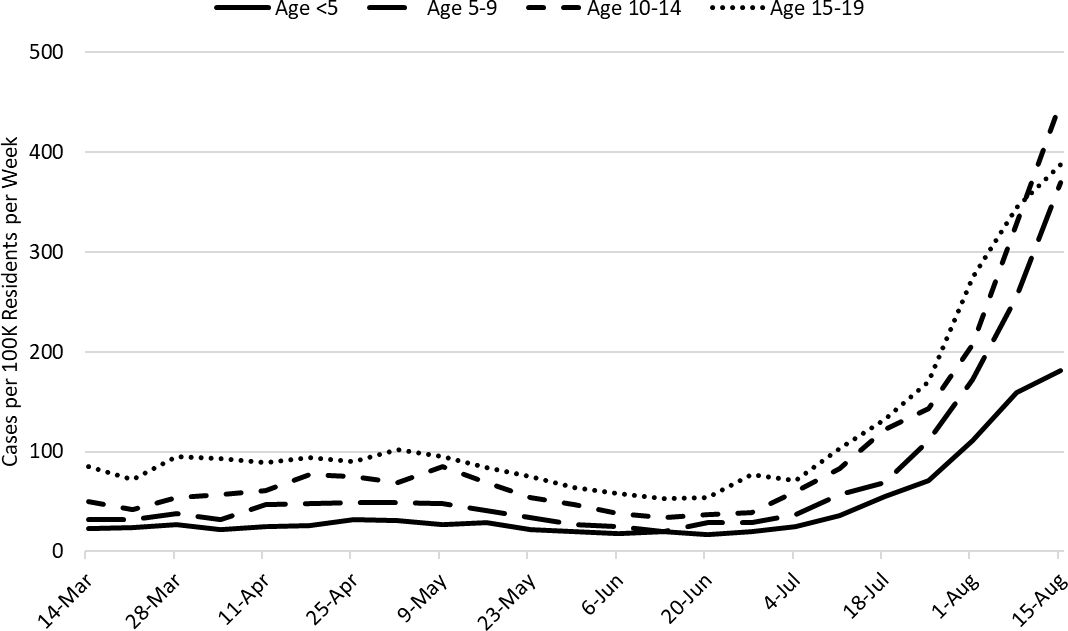
Figure 2b. Newly Diagnosed Covid-19 Cases in Arizona by Child Age Group March 7 – August 15, 2021. |
While transmission among adolescents and working-age adults remains high, rates among those aged 5 – 9 years and 10 – 14 years surpass those of other age groups for the first time during this pandemic (Figure 2c). Transmission rates among those 5 – 9 years is now 89% of their prior peak whereas transmission rates among those 10 – 14 years is 73% of their prior peak. To protect children, we must slow transmission among adults and institute more effective non-pharmacologic interventions in school settings.
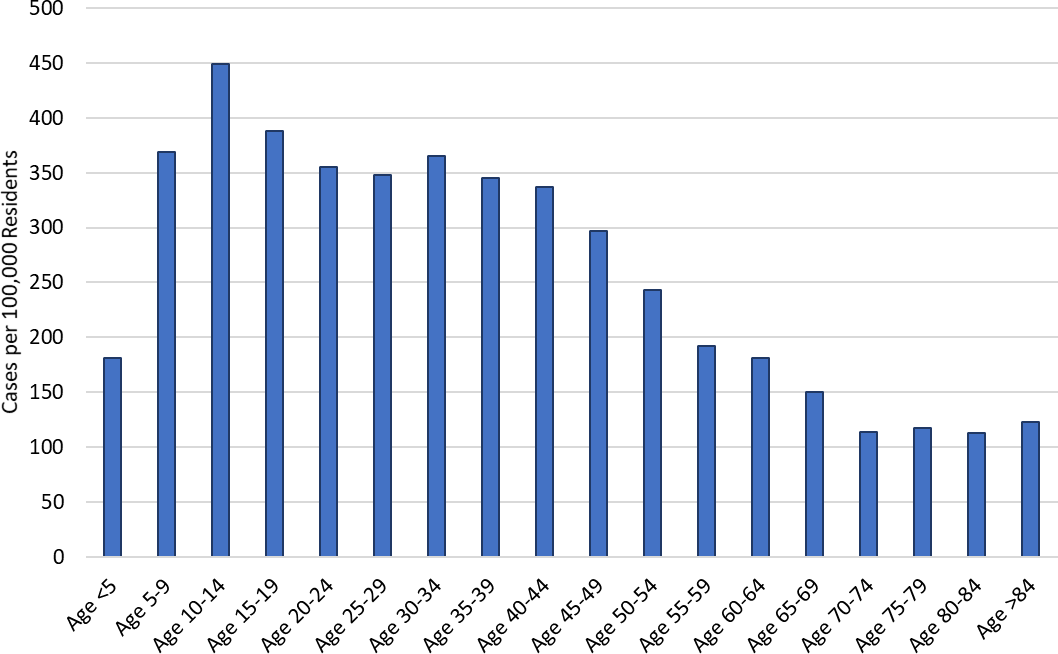
|
Figure 2c. Weekly COVID-19 Incidence by Age Group August 8 - 15, 2021. |
Vaccination, and now, K – 12 re-opening is shifting the age distribution of cases away from older adults towards children (Figure 2d). Children now represent about 25% of cases, up from 10% during the winter 2020 outbreak, while older adults now represent about 8% of cases, down from 15% during the winter 2020 outbreak.
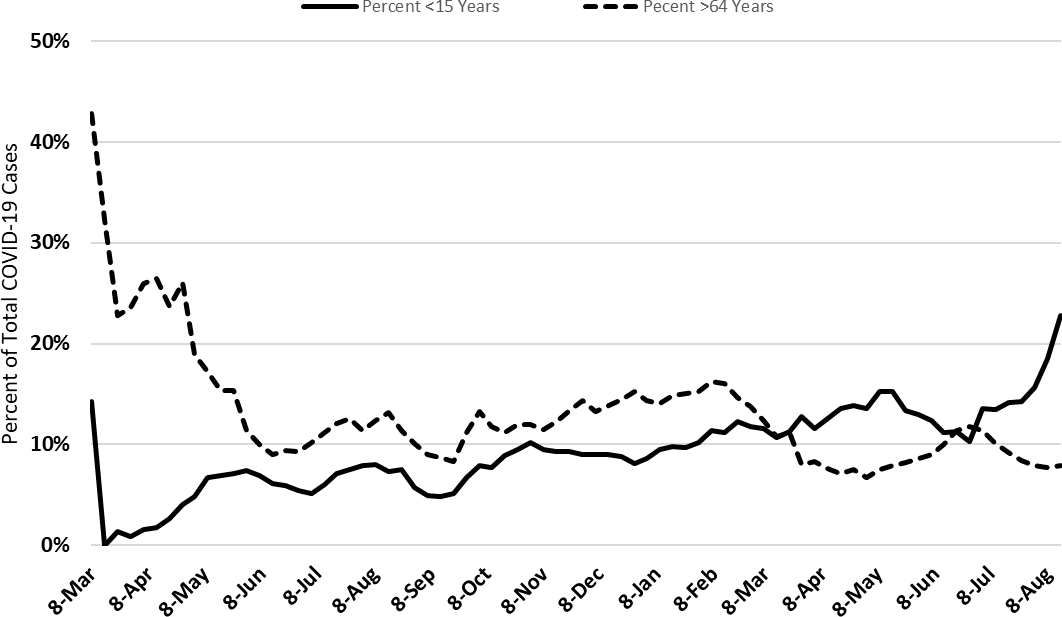
|
Figure 2d. Percent of COVID-19 Cases Attributable to Children and Older Adults March 1 – August 15, 2021. |
To create a mental frame, it is helpful to compare our current circumstances to those previously experienced. Comparing school reopening this year (in-person) with last year (virtual), levels of community transmission are much higher this year (Figure 2e).
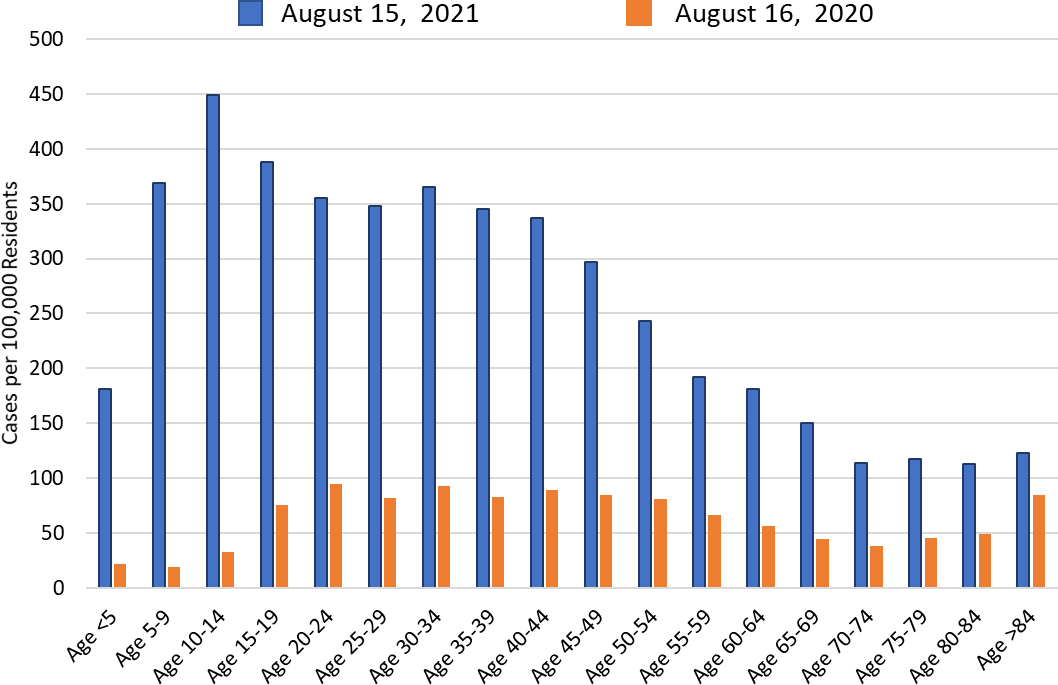
|
Figure 2e. COVID-19 Cases by Age Group, Second Week August 2020 versus August 2021. |
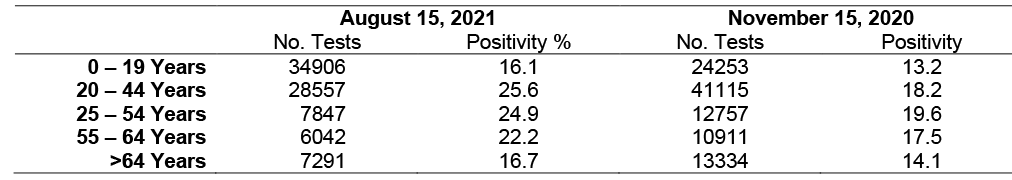
By comparing two different time periods with similar levels of transmission (August 15, 2021 and November 15, 2020), a shift towards younger age at time of diagnosis becomes apparent (Figure 2f). The most striking increases have occurred among those 40 years of age.
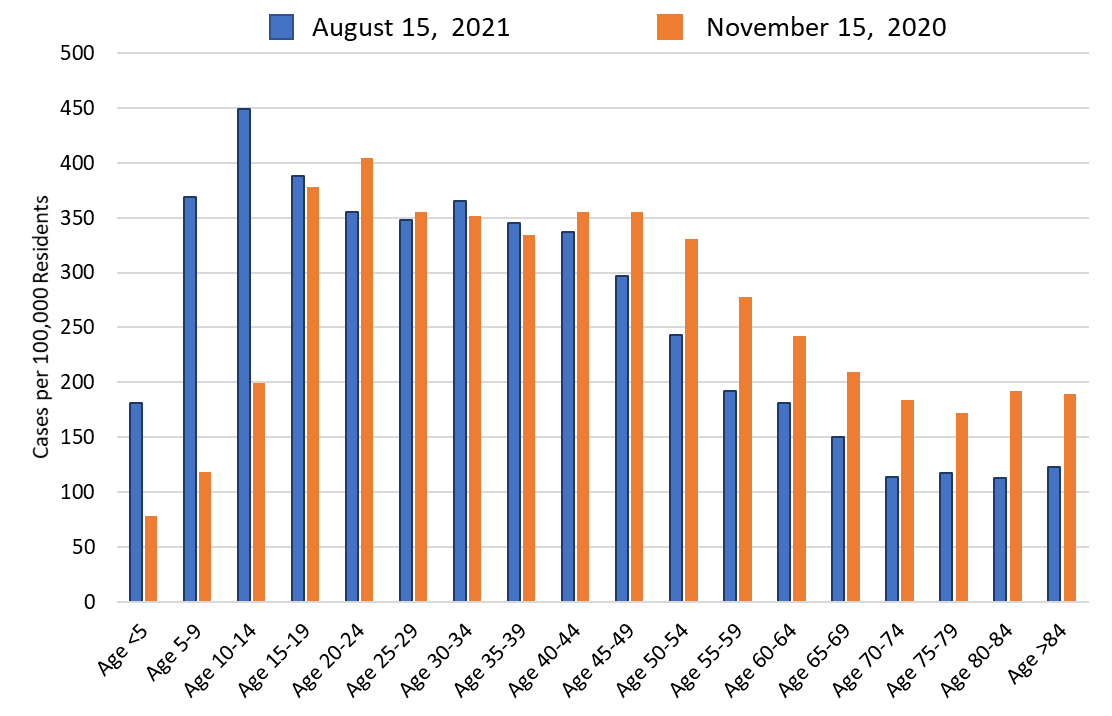
|
Figure 2f. COVID-19 Cases by Age Group, August 15, 2021 (282 cases per 100K residents) versus November 15, 2020 (275 cases per 100K residents). |
Until this week, there was a high degree of concordance between the trajectory of our current outbreak and that of the winter 2020/2021 outbreak (Figure 2g). With this week’s slowing, there is a suggestion that the two curves could be diverging. Because the past outbreak was marked by temporary retreats followed by renewed charges, it is too early to tell whether this week was an aberration or a harbinger of a sustained change.
|
Figure 2g. Fall 2020 and Fall 2021 Covid-19 Wave Superimposed (81 days). |
Another consideration is how testing availability and priority has changed over time. The number of tests performed and test positivity by age group for two different time periods with similar levels of transmission are presented in Table 1. Among children, there is considerably more testing now than in November 2020 whereas the reverse is true for adults. All groups have higher test positivity now than last November. Taken together, it seems possible that more children and fewer adults might be identified now as compared to last November owing to differential testing. However, the differences are not so large as to think higher transmission among children is solely an artifact of increased testing.
|
Table 1. COVID-19 Testing Counts and Test Positivity at Two Periods with Similar Levels of Transmission |
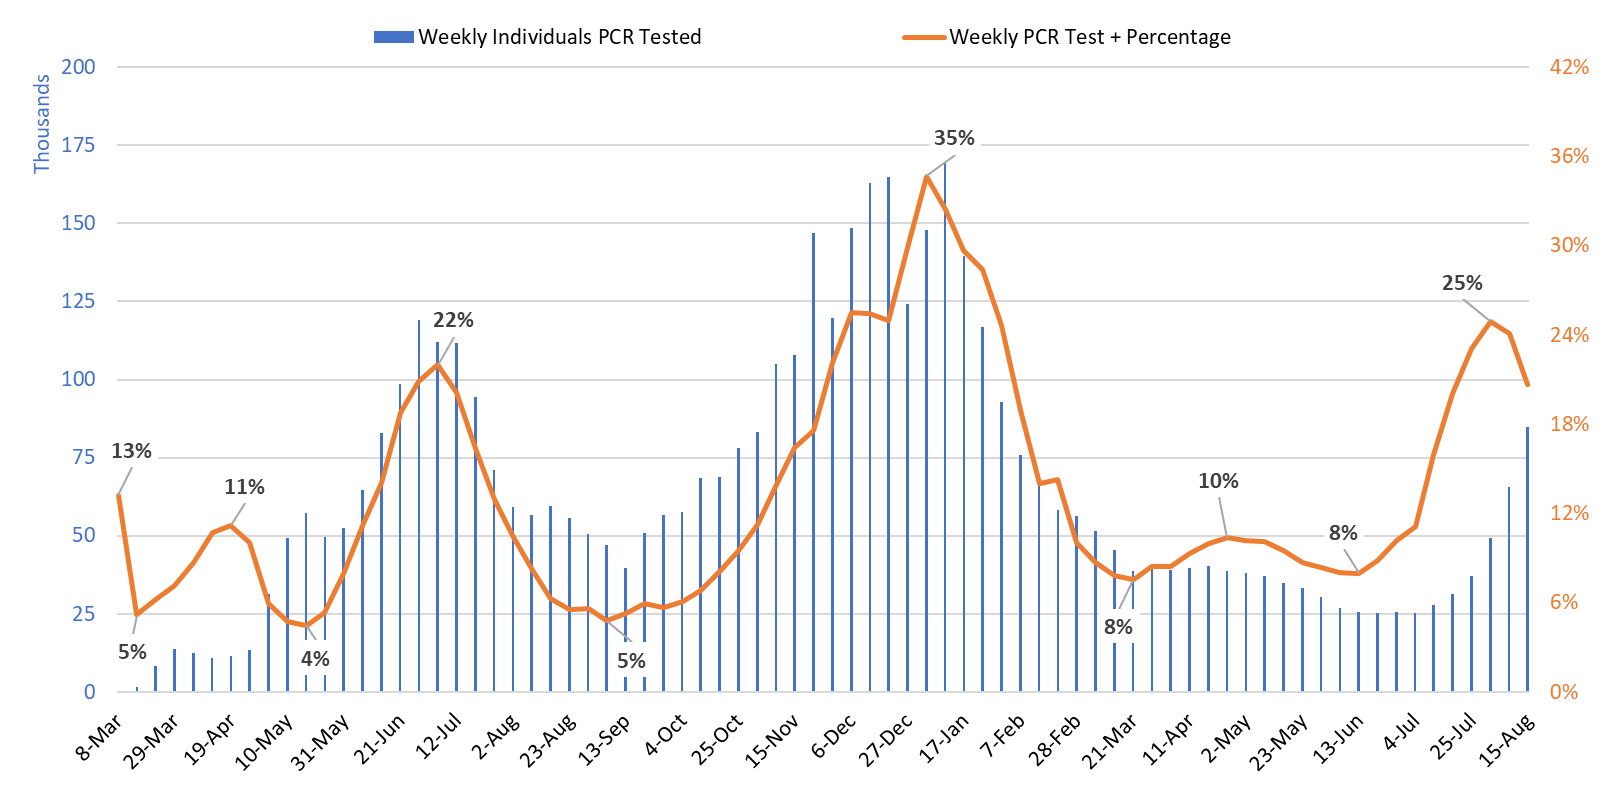
Test positivity among those undergoing traditional nasopharyngeal PCR testing dropped this week to 21% (Figure 3). This level indicates testing is inadequate for optimal public health practice and means many cases are going undiagnosed. Prior peaks in test positivity have preceded peak transmission rates by 1 week. Historically, peak test positivity has preceded peak transmission by 1 week. This provides some additional indication that slowing transmission could reflect a sustained change.
|
Figure 3. Weekly Number Patients Undergoing Traditional Nasopharyngeal PCR Testing and Associated Percent Positivity March 1, 2020 – August 15, 2021. |
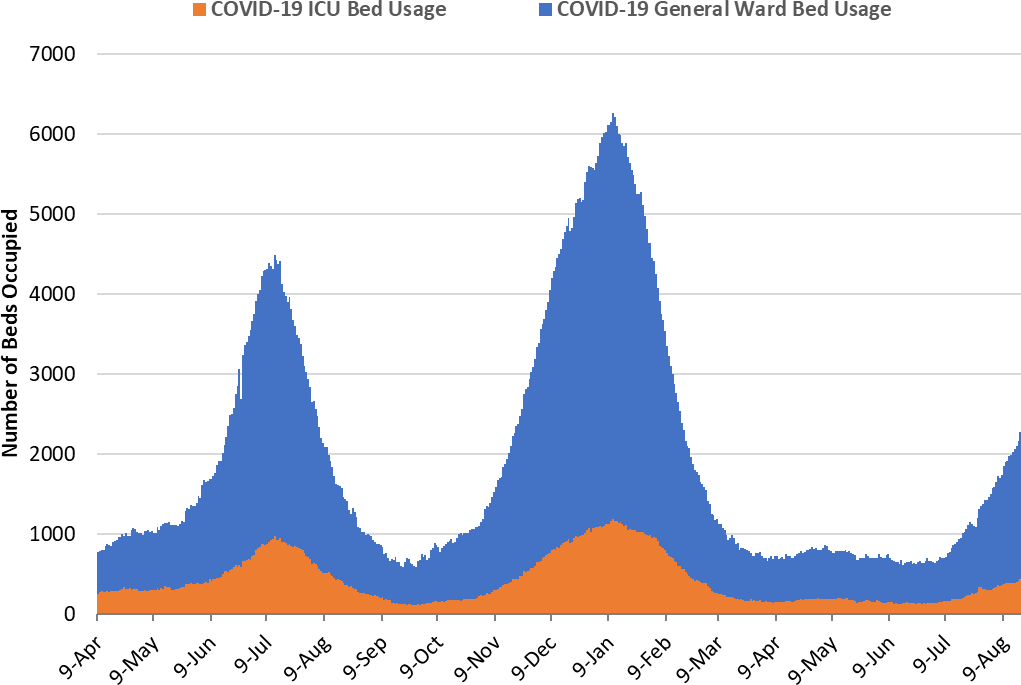
As of Aug 18th, 1837 (21%) of Arizona’s 8762 general ward beds were occupied by Covid-19 patients, a 20% increase from the previous week’s 1527 occupied beds (Figure 4 and Figure 5 Panel A). Another 717 (8%) beds remained available for use. The number of available beds is lower than the previous week’s 797 beds.
|
Figure 4. Arizona Daily Covid-19 General Ward and ICU Census April 9, 2020 – August 18, 2021. |
As of August 18th, 432 (25%) of Arizona’s 1758 ICU beds were occupied with Covid-19 patients, a 13% increase from the prior week’s count of 383 patients (Figure 4 and Figure 5 Panel B). An additional 189 (11%) ICU beds remained available for use, a bit higher than last week’s 174 beds.
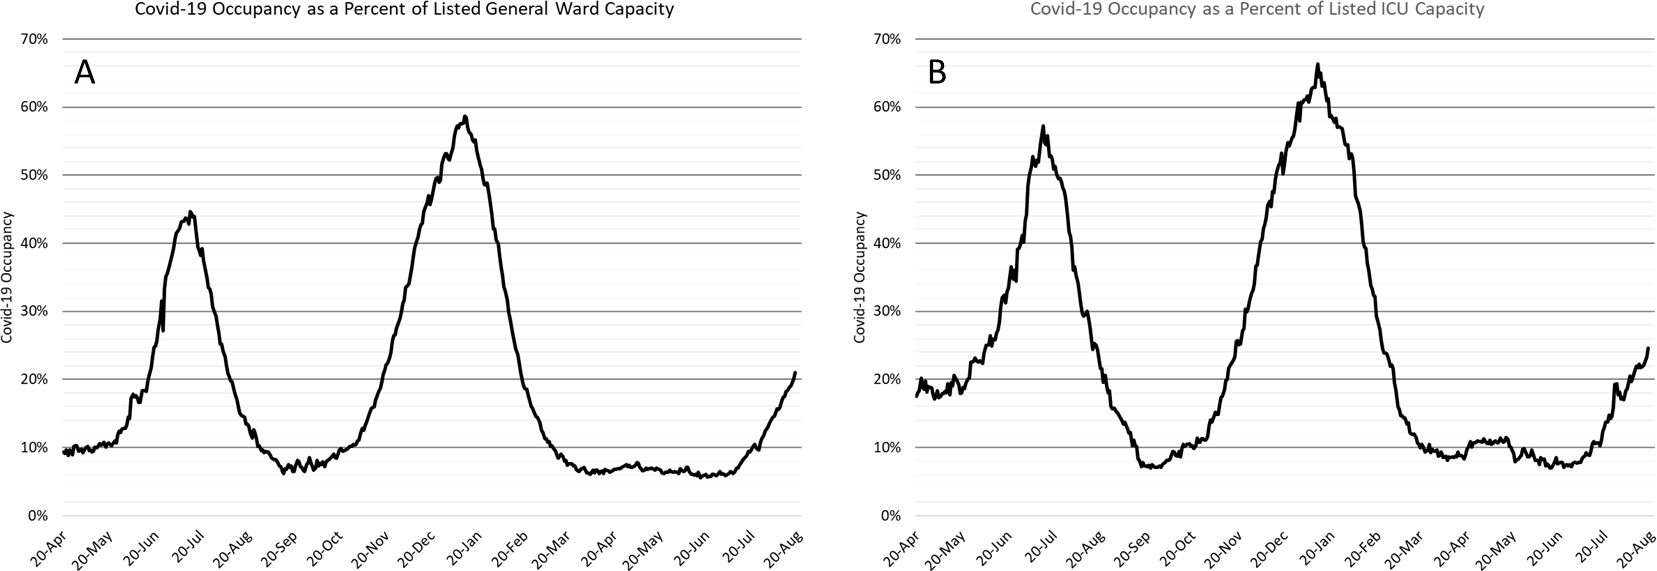
|
Figure 5. Covid-19 Occupancy as a Percent of Listed General Ward (A, left) and ICU (B, right) Capacity in Arizona April 20, 2020 – August 18, 2021. |
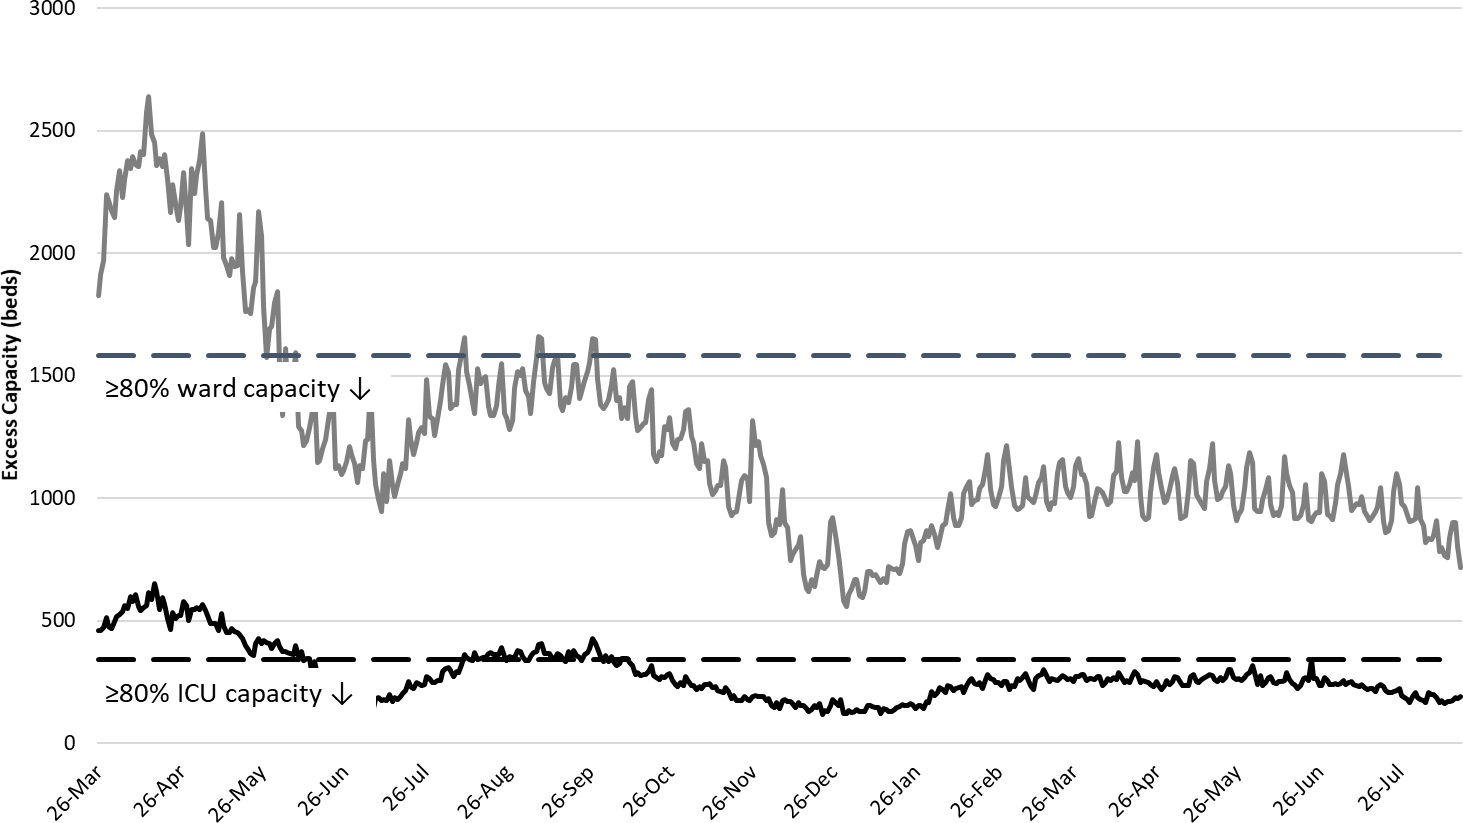
Arizona hospital occupancy remains above seasonal levels and we are now seeing the first indications that our safety margin as measured by excess, available ward and ICU beds is eroding (Figure 6). Undoubtedly, some medically necessary procedures will likely be postponed and rescheduled over the coming weeks to make room for critically ill COVID-19 patients. Hospitals should be prepared for >20% COVID-19 ward occupancy and >25% ICU occupancy for the foreseeable future. Even if you are vaccinated, the COVID-19 surge can impact your health should you become ill and required hospital care. In the essence, care will become increasingly more rationed over the coming weeks with only the sickest of the sick being able to access critical care services.
|
Figure 6. Observed Excess Non-Surge General Ward and ICU Capacity March 26, 2020 – August 18, 2021. |
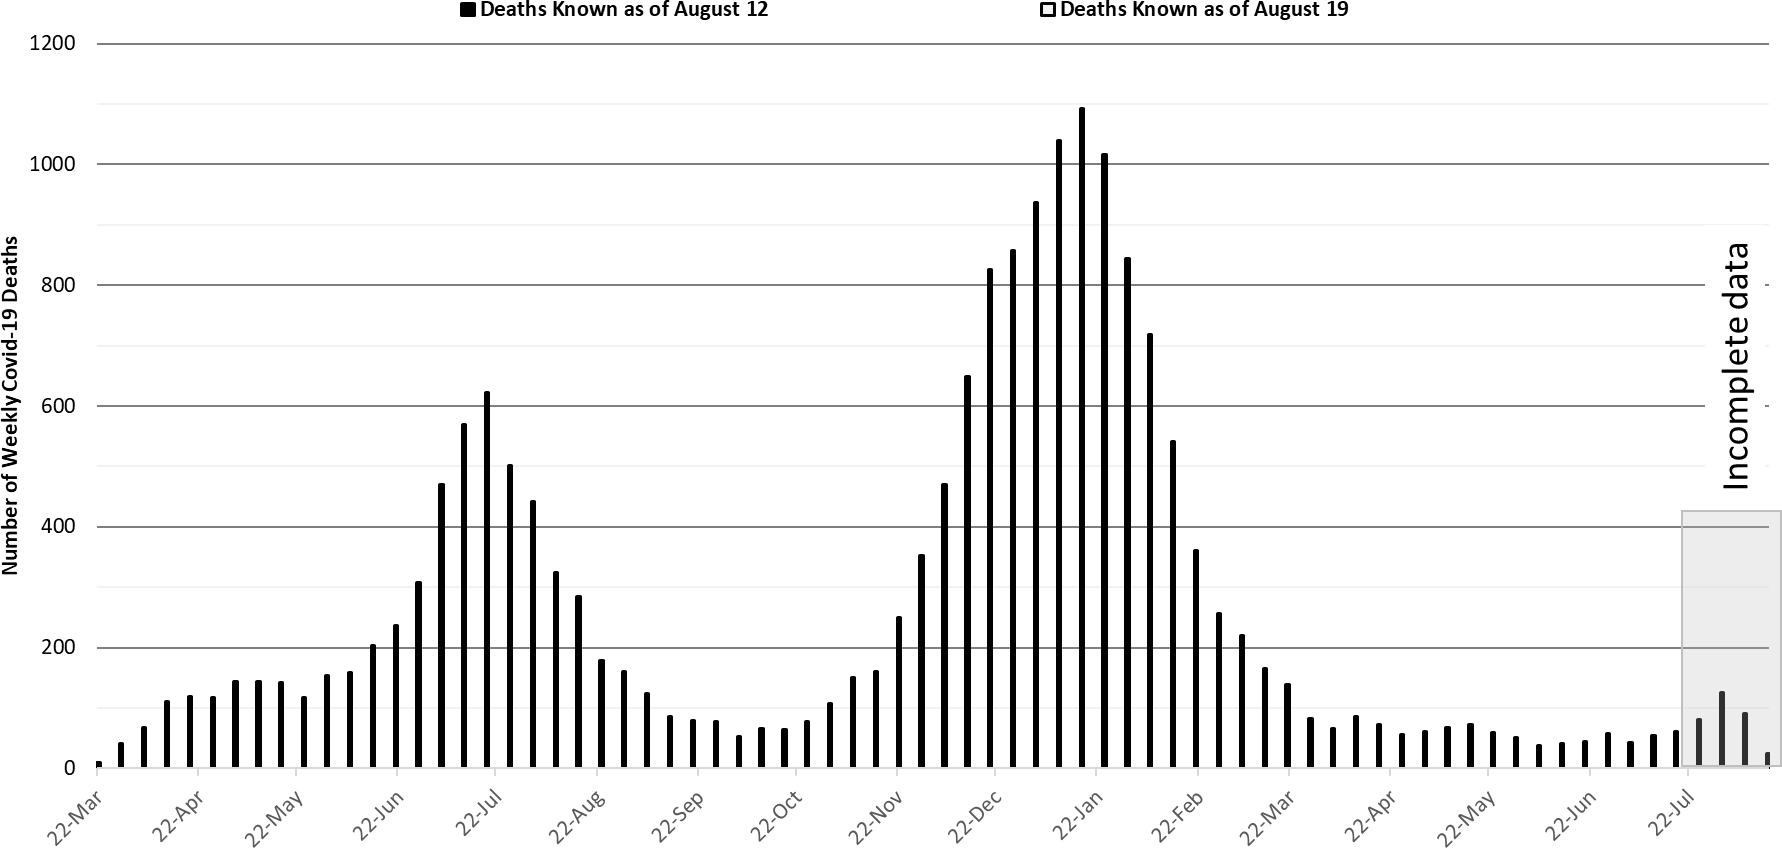
While the week ending January 17, 2021 remains Arizona’s deadliest with 1093 deaths, we are once again seeing >100 COVID-19 deaths per week. The week ending August 1st tallied 126 deaths so far with a few more likely to be recorded in the coming weeks. Given weekly tallies of 18 - 20000 cases, it is possible we will see approximately 300 deaths per week by the end of August if the case fatality rate remains consistent at approximately 1.5%.
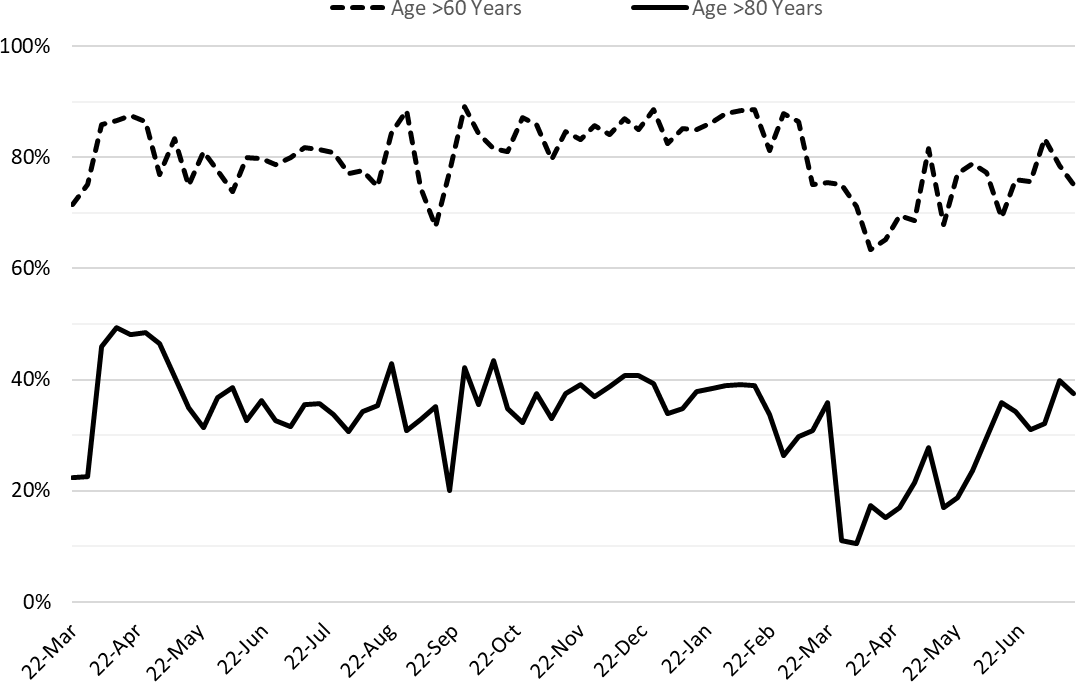
Despite high vaccination rates among those >65 years of age, most deaths are still attributable to infections among this medically frail group (Figure 7b).
|
Figure 7a. Weekly Arizona Covid-19 Deaths March 16, 2020 – August 15, 2021. |
|
Figure 7b. Percent of COVID-19 Deaths Attributable to Those >60 Years and >80 Years, March 16, 2020 – July 18, 2021. |
Pima County Outlook
For the week ending August 8th, 1804 Pima County residents were diagnosed with Covid-19 (Figure 8). This is a 2% increase from the 1762 cases initially reported last week.
|
Figure 8. Covid-19 Cases and Individuals Undergoing Testing in Pima County Mar 1, 2020 – August 15, 2021 |
New cases are being diagnosed at a rate of 172 cases per 100K residents per week. This rate is increasing by 2 cases per 100K residents per week. Trends across the various age groups appear in Figure 9 (Note: the abrupt downturn among working-age adult is a bit suspicious).
|
Figure 9. Covid-19 Cases by Age Group in Pima County from March 14 – August 15, 2021. |
Summary
- Arizona continues to experience high levels of community transmission. Increases in transmission were moderated this week; however, temporary “pauses” have been observed in previous waves. With continued K – 12 in-person instruction plus opening of our major universities, there will be additional pressure on transmission among children and young adults. If transmission in these groups spillover, then another surge of cases and hospitalizations similar to that of the summer of 2020 remains possible.
- As of August 15th, new cases were being diagnosed at a rate of 278 cases per 100,000 residents per week. The rate was increasing at 24 cases per 100,000 residents per week. Another wave of cases and hospitalizations caused by the Delta variant is certain; the only question is how big.
- The age distribution of transmission is undergoing a profound shift with case rates among children <15 years set to exceed those of all other age groups for the first time. Transmission among children is certainly driven by in-person instruction in the presence of the Delta variant.
- Vaccination remains the most important public health priority to reduce viral transmission and severe illness over the long-term; however, in the short-term only masking, restrictions on indoor gatherings, and targeted business restrictions will reduce current transmission. Masking works people!
- Resumption of in-person instruction in K – 12 schools and universities will lead to frequent school-associated outbreaks and contribute to community transmission. A layered approach with multiple non-pharmacologic interventions is necessary to return students safely to in-person schooling.
- Hospital COVID-19 occupancy is increasing and is likely to exceed 20% of all beds in the general ward and 25% of beds in the ICU for weeks to come. Access to care is becoming more restricted as COVID19 occupancy is increasing. Expect delays in elective procedures to once again mount.
- There is no evidence that existing vaccination levels will meaningfully blunt the impact of community transmission on hospitals. Hospitals should prepare for another meaningful surge that will strain staffing in critical care areas and lead to critical shortages.
- Arizona is now experiencing >100 deaths per week. This amount will increase in the coming weeks and will almost certainly reach 300 per week by the end of August – early September.
- According to the CDC, 57% of Arizona adults have received at least 2-doses of vaccine while another 10% have received 1-dose. In the face of the Delta variant, this is wholly insufficient.
- Despite evidence of limited immune escape to the Delta variant, especially before completion of the full vaccination sequence, vaccination continues to provide extraordinarily high levels of protection from severe illness.
- Dr. Deepta Bhattacharya discussed what we know so far about COVID-19 vaccines, the interactions between the vaccines and the latest variants, and the best strategies for staying healthy and safe.
- The CDC revised its mask guidance for vaccinated individuals. Fully vaccinated individuals should mask when indoors in public spaces where community transmission is high or substantial. If exposed to a known case, individuals should be tested in 3 – 5 days regardless of symptoms and wear a mask for 14 days post-exposure.
Forecast reports to date, available as PDFs
Download PDF to view additional charts of Arizona counties, available in appendix of report.
2020 Reports
Based on what we know now about this pandemic, we support guidelines for social distancing to slow the spread of the virus and urge everyone to follow the recommendations provided by the Centers for Disease Control and Prevention (CDC) to protect yourself, your family, your neighbors, and your employees. Please heed the recommendations as provided by the CDC.
COVID covid coronavirus virus covid19 corona forecast model

