


Note this forecast page is not the most recent forecast available.
View the most current forecast report
Researcher Analyzes Arizona COVID-19 Spread Models for Decision-Makers
The following information regarding the spread of COVID-19 in Arizona was prepared by Joe Gerald, MD, PhD, a researcher at the Mel and Enid Zuckerman College of Public Health (MEZCOPH) at the University of Arizona. This information has also been reviewed by other MEZCOPH faculty.
This data were obtained from the Arizona Department of Health Services COVID-19 webpage and reflect conditions in Arizona as of December 24, 2021.
This information is intended to help guide our response to the outbreak. It is not intended to predict how this pandemic will evolve. Rather, this model extrapolates what might occur if current conditions remain unchanged. As regional authorities and healthcare providers respond, their actions are expected to mitigate the worst consequences of this pandemic.

COVID-19 Disease Outbreak Forecast
Arizona State and Pima County
Updated December 24, 2021
Disclaimer: This information represents my personal views and not those of The University of Arizona, the Zuckerman College of Public Health, or any other government entity. Any opinions, forecasts, or recommendations should be considered in conjunction with other corroborating and conflicting data. Updates can be accessed at https://publichealth.arizona.edu/news/2021/covid-19-forecast-model.
|
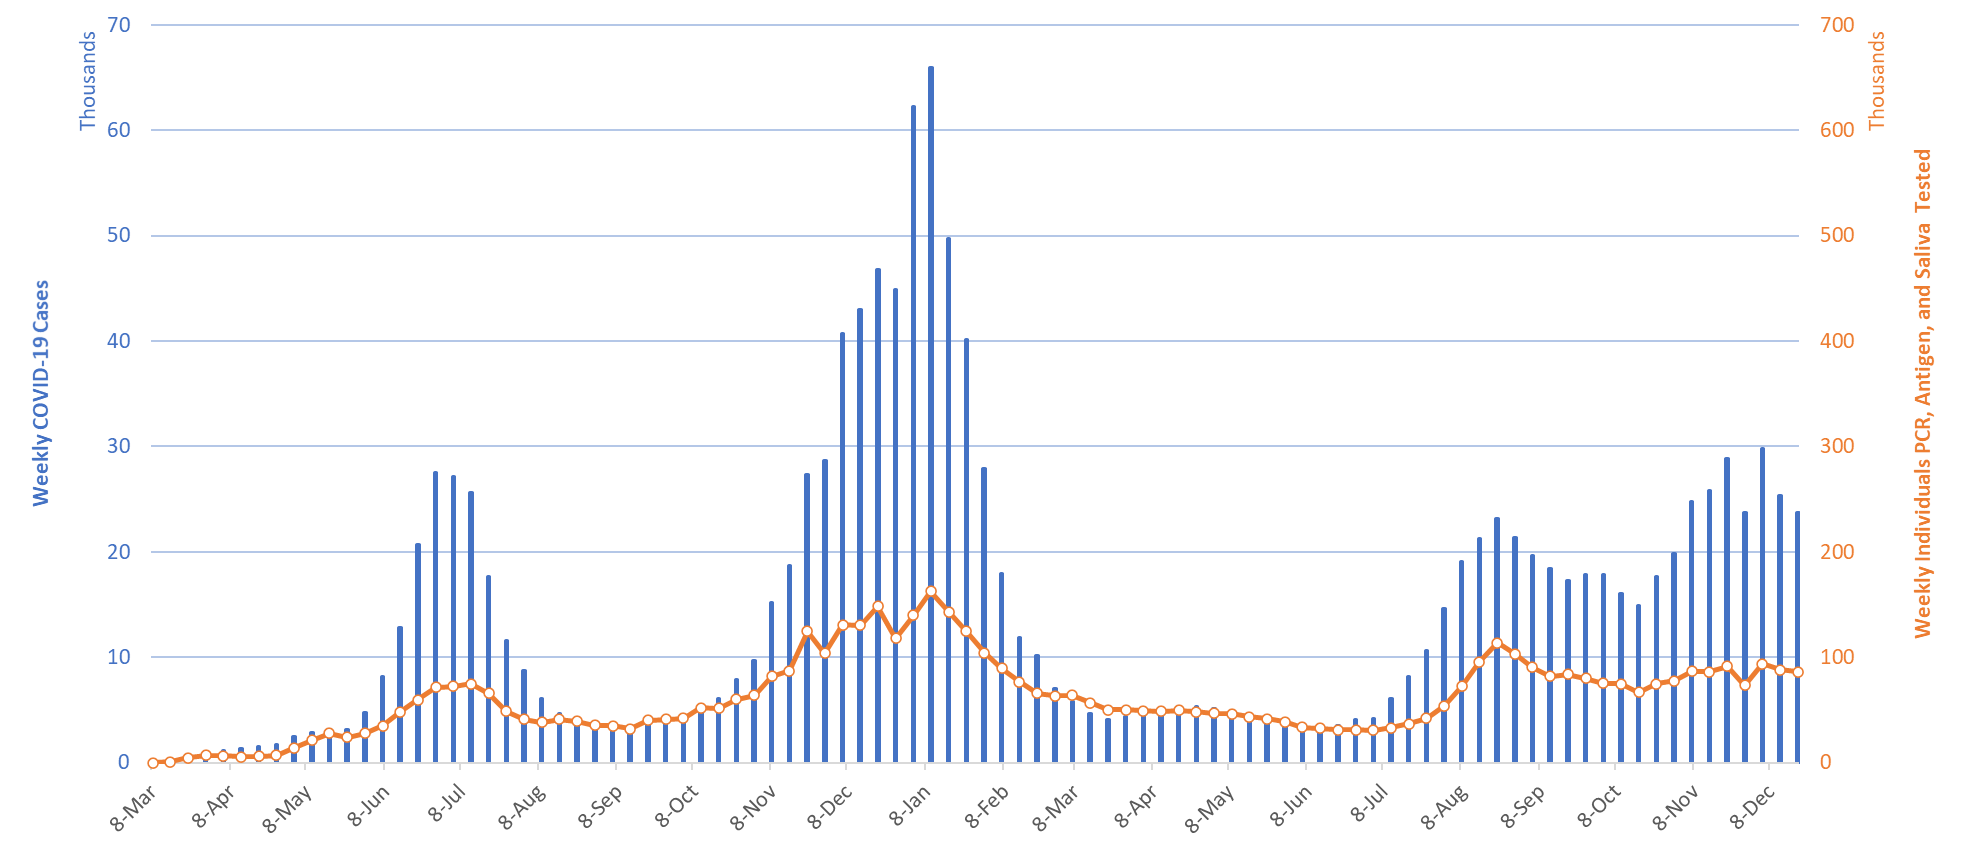
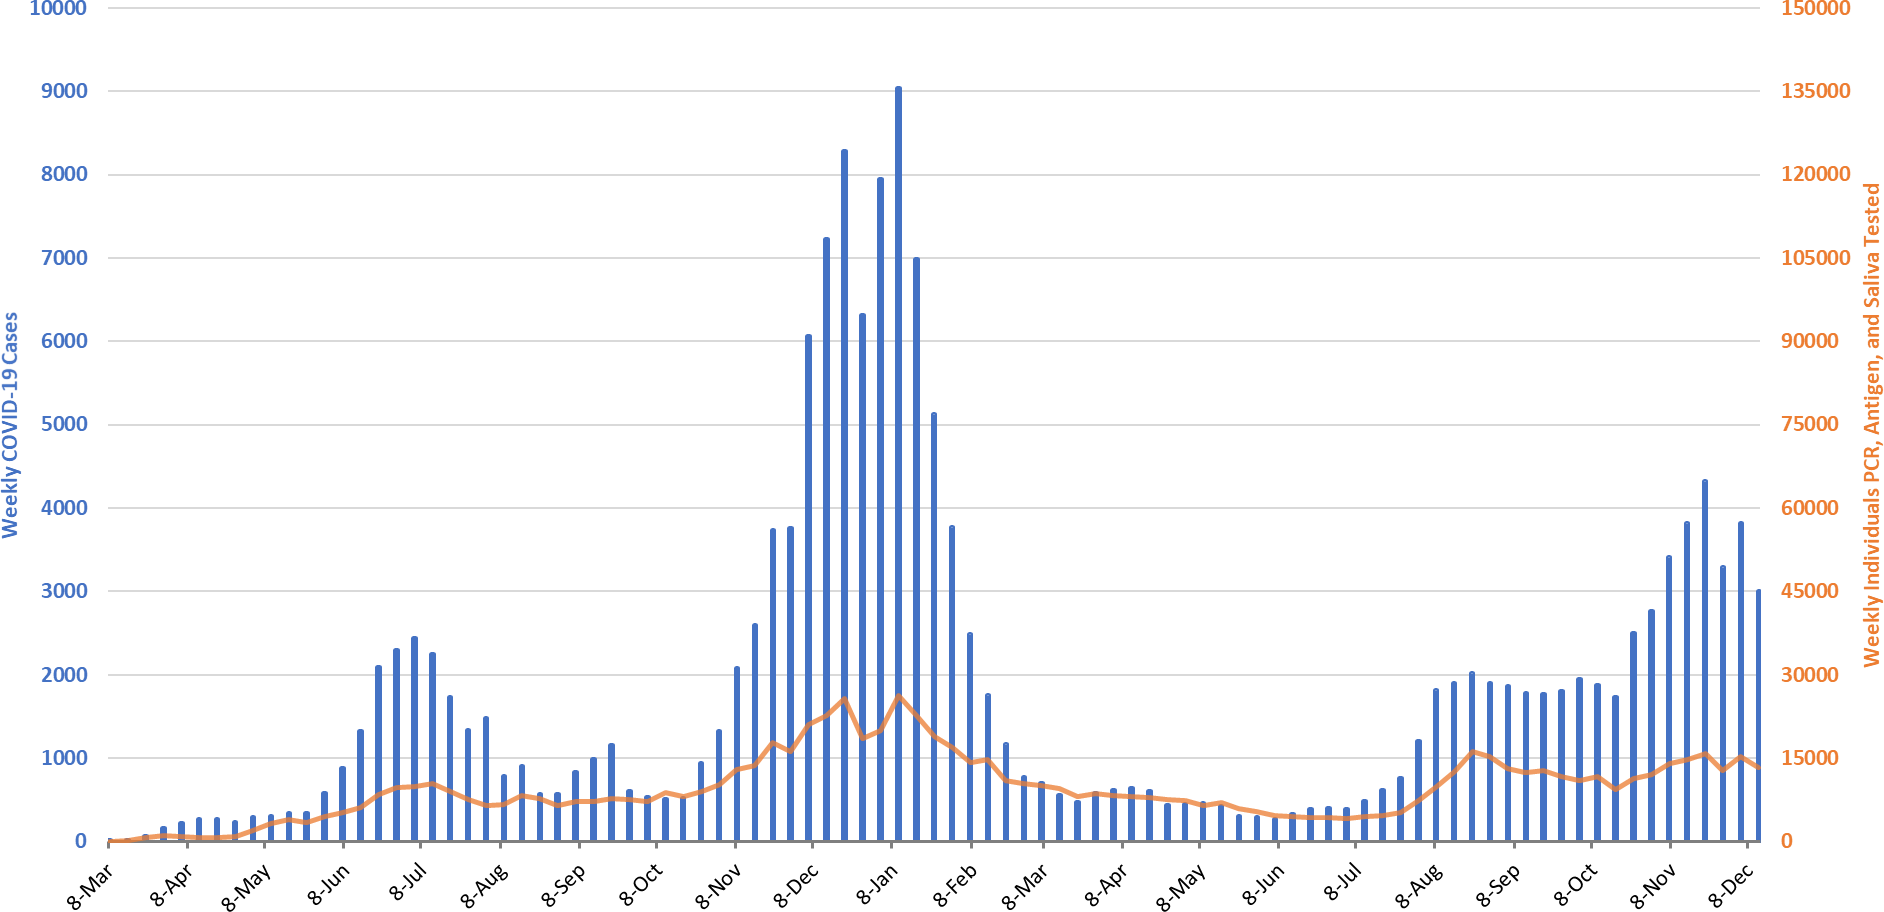
Figure 1. Weekly COVID-19 Cases in Arizona and Number of Individuals Undergoing COVID-19 Diagnostic Testing March 1, 2020 – December 19, 2021. |
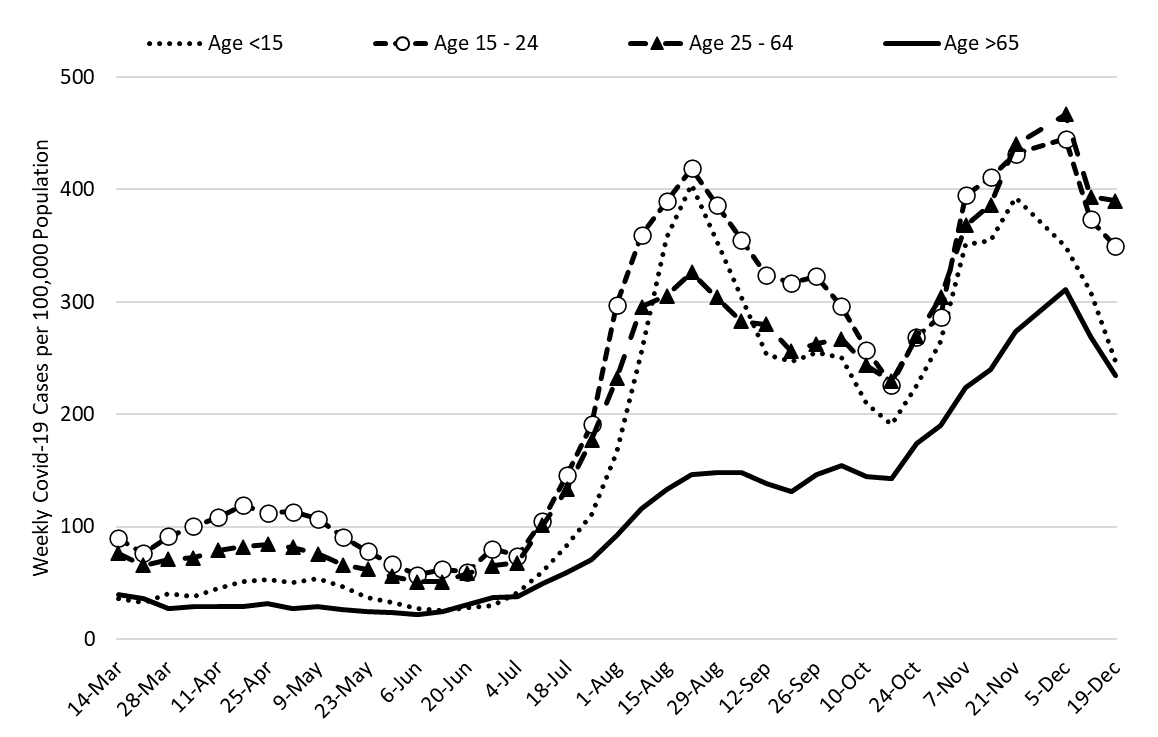
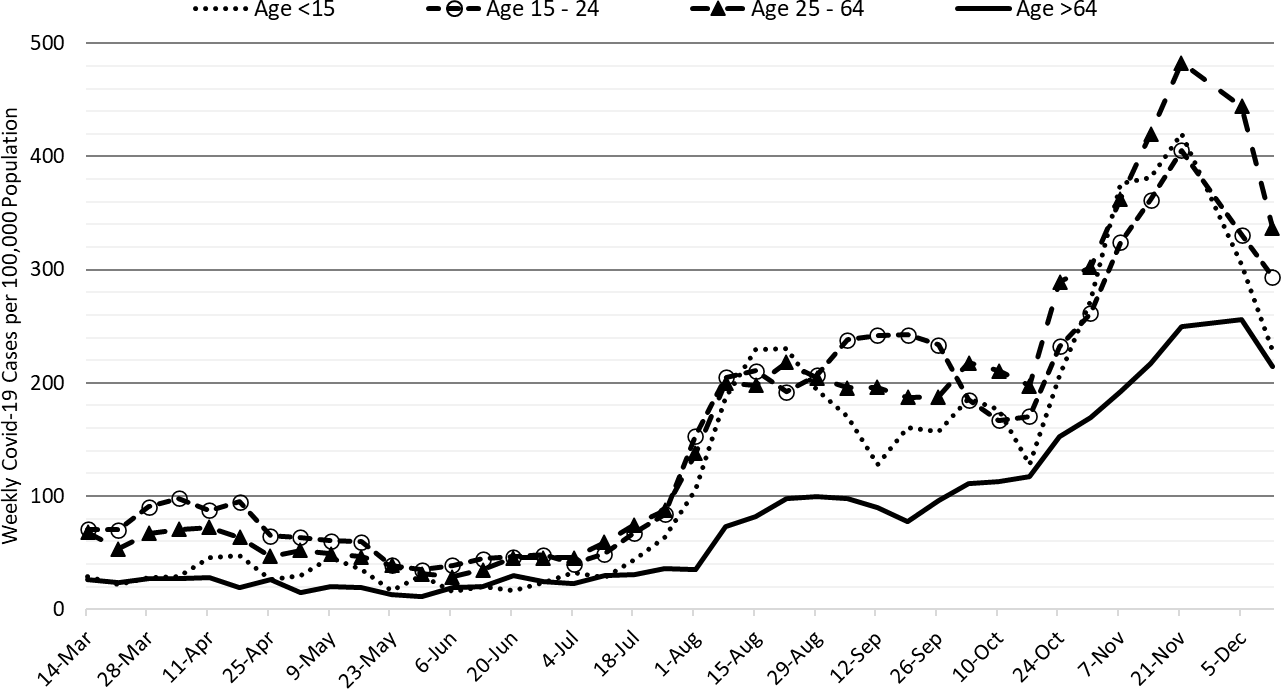
For the week ending December 19th, 23704 Arizonans were diagnosed with COVID-19, a 3% decrease from the 24424 cases initially reported last week (Figure 1). Cases are currently being diagnosed at a rate of 326 cases per 100K residents per week. Rates are highest among those 25 – 64 years and lowest among those ≥65 years, 390 and 234 cases per 100K residents, respectively (Figure 2a following page). As an early harbiner of the imminent Omicron wave, rates among those 20 – 39 years are now increasing (data not shown).
Arizona’s new case ranking has dropped to 30th. The nation’s current leaders are Rhode Island (857), New York (842), New Jersey (643), Illinois (639), and Massachusetts (624). Note: New York City (1124) and District of Columbia (1104) have even higher rates as metropolitan subunits. According to the CDC, only 31% of Arizona adults and 50% of its seniors are vaccinated with a third dose booster. The ADHS Vaccine Dashboard shows weekly doses delivered dropped 20% to 165K doses. The CDC recommends everyone ≥18 years should receive a booster and has widened eligibility to those 16 – 17 years. With winter here, waning immunity among those without a booster will place them at risk of breakthrough infection from the circulating Omicron variant.
GROUND HOG DAY → Arizona continues to experience a high number of cases, hospitalizations, and deaths. With waning vaccine efficacy and a potentially short duration of acquired immunity, herd immunity is not achievable. As time progresses, more individuals will become susceptible. While the previously vaccinated and previously infected will remain mostly protected from severe outcomes, they will contribute to community transmission. Unvaccinated Arizonans will not be able to avoid infection by “free riding” on high levels of community immunity. The decision to remain unvaccinated carries a much greater risk than getting vaccinated. For the vaccinated, third-shot boosters provide additional protection and should be a priority for anyone >50 years to ward off infection from the Delta variant or the newly dominant Omicron variant.
Figure 2a shows transmission among all age groups is declining. However, rates among those 25 – 64 years are flattening driven by increases among those 20 – 39 years (data not shown). With Omicron being the dominant variant, expect cases among working age adults to sharply increase in the coming days. Changing testing patterns during Christmas and the New Year’s holidays will tend to underestimate increases in viral transmission. Hospital COVID-19 occupancy, a consistent but lagging indicator, will be less useful in the weeks ahead because of how rapidly Omicron transmits.
|
Figure 2a. COVID-19 Cases in Arizona by Age Group March 7 – December 19, 2021 (Data from week ending November 28 suppressed). |
|
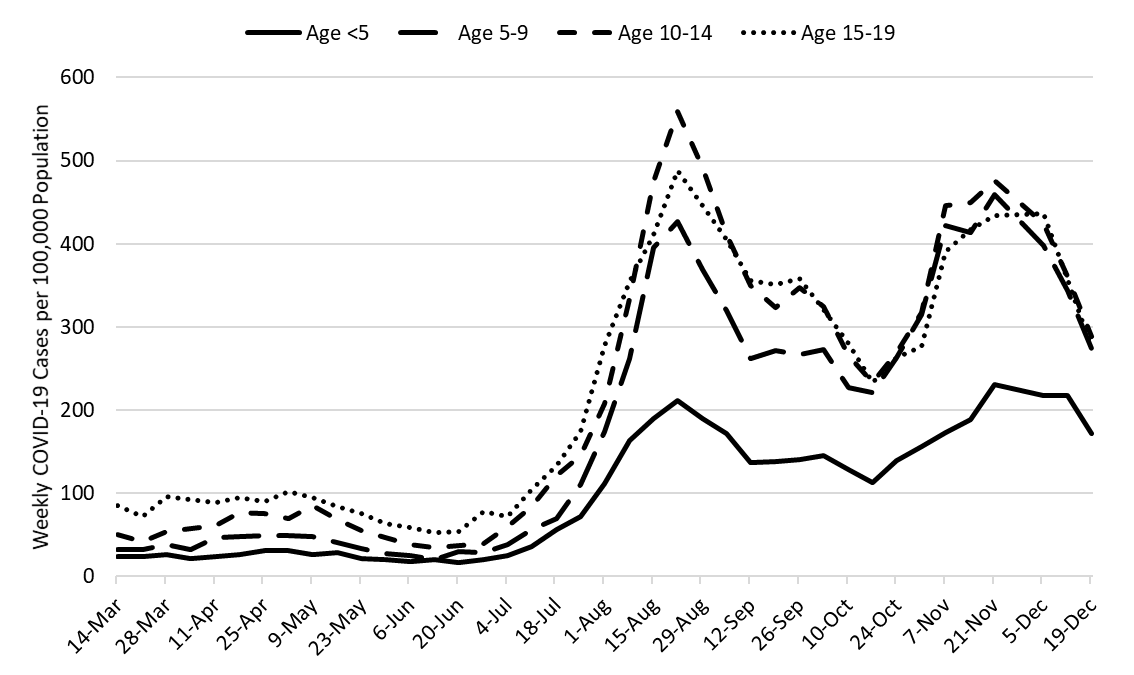
Figure 2b. COVID-19 Cases in Arizona among Children by Age Group March 7 – December 19, 2021. (Data from week ending November 28 suppressed). |
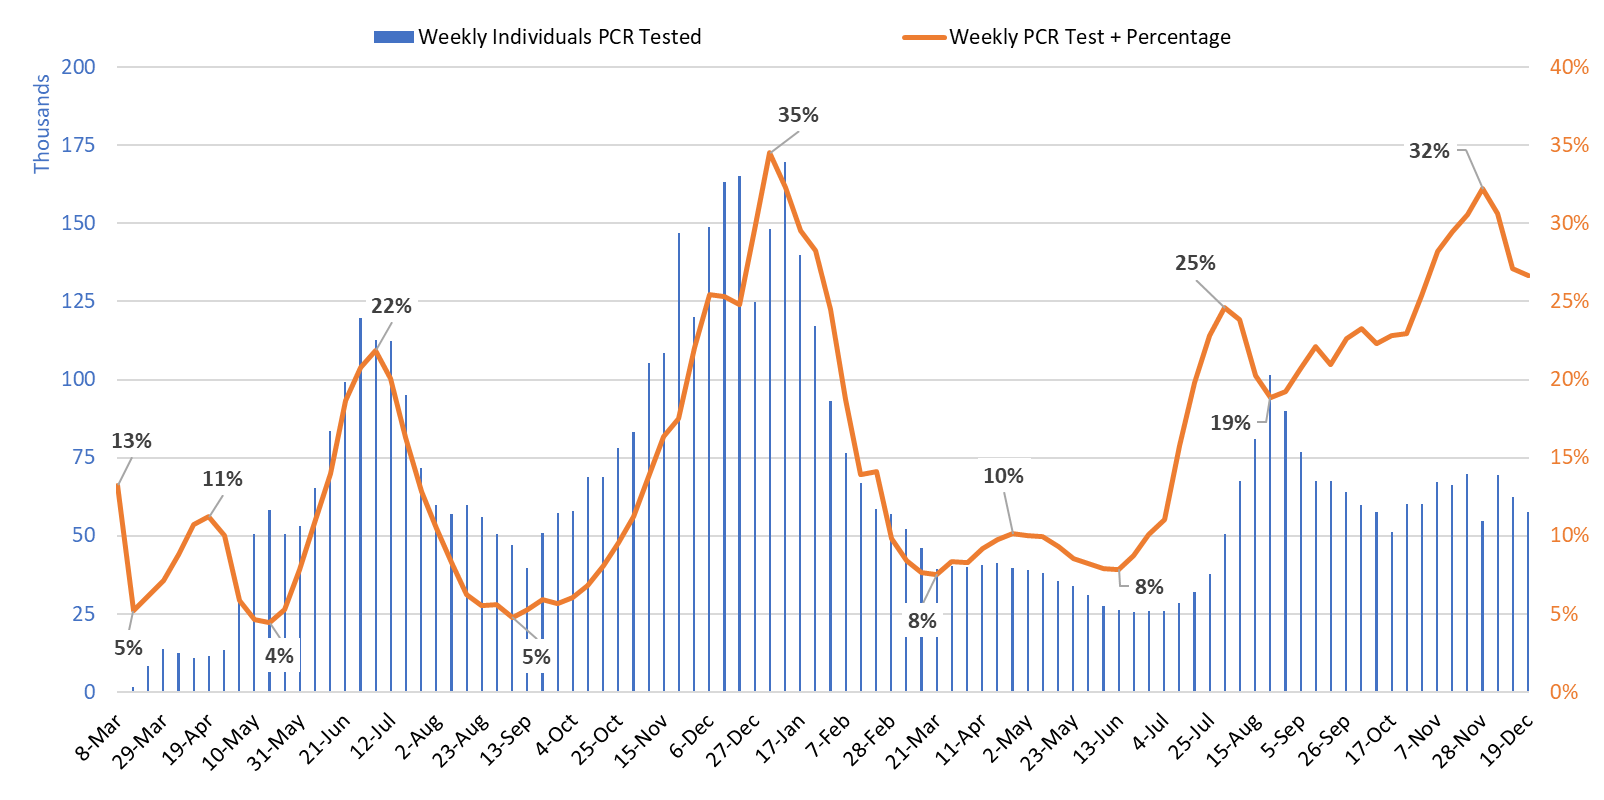
Test positivity held steady at 27% this week. Testing remains inadequate for public health practice and many cases are going undiagnosed (Figure 3).
|
Figure 3. Weekly Number of Patients Undergoing Traditional Nasopharyngeal PCR Testing and Associated Percent Positivity March 1, 2020 – December 19, 2021. |
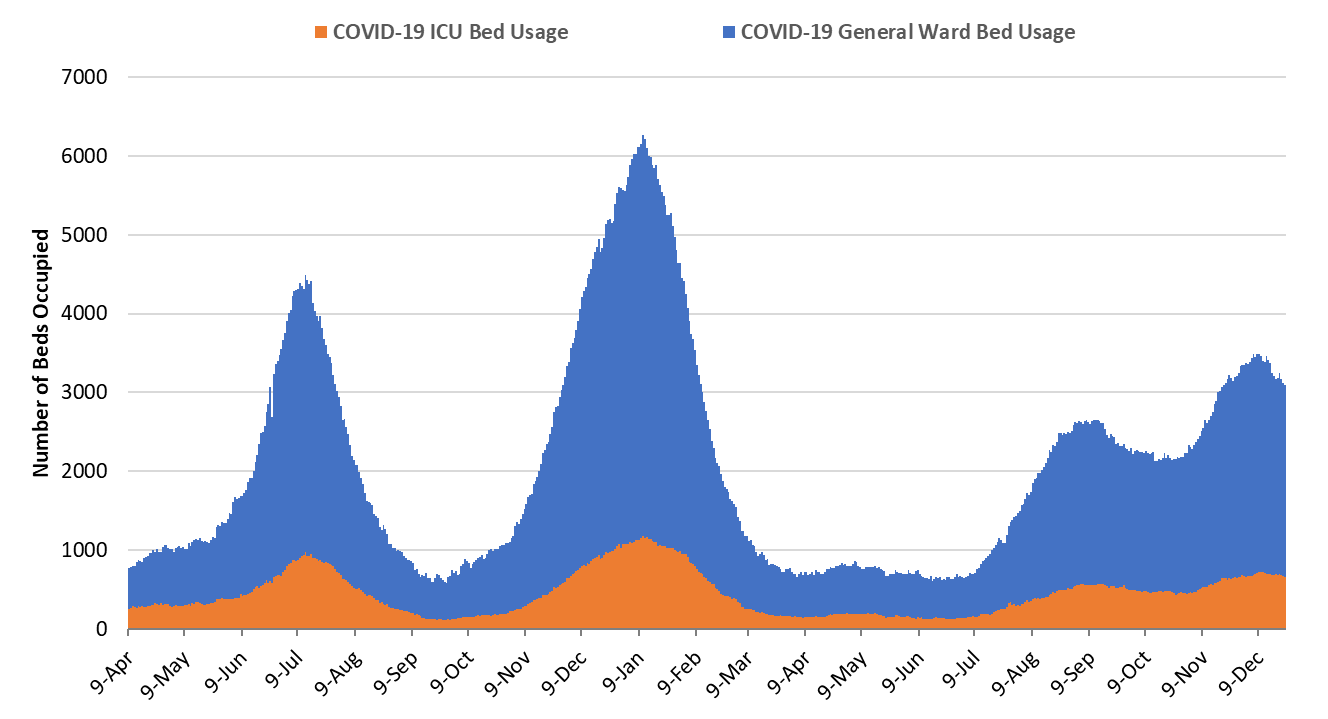
As of December 23rd, 2440 (28%) of Arizona’s 8796 general ward beds were occupied by COVID-19 patients, a 5% decrease from last week’s 2569 occupied beds (Figure 4 and Figure 5 Panel A). Another 534 (6%) beds remained available for use which is higher last week’s 418 available beds. Six-hundred fifty-nine (659, 40%) of Arizona’s 1670 ICU beds were occupied by COVID-19 patients, a 4% decrease from last week’s 684 occupied beds (Figure 4 and Figure 5 Panel B). An additional 93 (6%) ICU beds remained available for use which is higher than last week’s 83 beds. For the past week, 100 ICU beds stopped reporting or were taken out of circulation; therefore, these numbers may underestimate ICU utilization.
|
Figure 4. Arizona Daily COVID-19 General Ward and ICU Census April 9, 2020 – December 23, 2021. |
While peak occupancy will not reach prior levels, the base of the Delta wave is broader. The Delta wave has so far seen 133 days with a combined occupancy >2000 patients whereas the summer 2020 and winter 2021 waves saw 57 and 98 days, respectively. We have now had >3000 combined occupancy for 37 days whereas the summer 2020 and winter 2021 waves saw 35 and 78 days, respectively. With Omicron overtaking Delta, expect occupancy to remain relatively stable until mid-late January then increase into early-mid February.
|
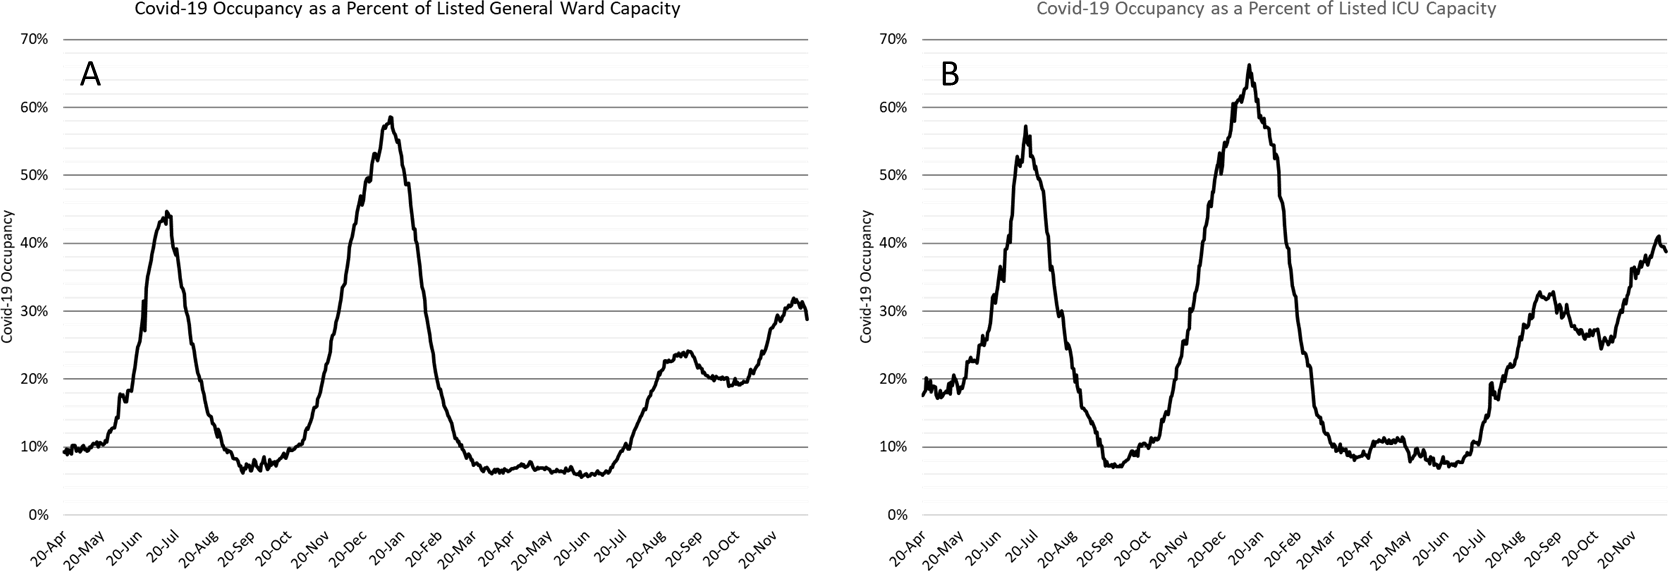
Figure 5. COVID-19 Occupancy as a Percent of Listed General Ward (A, left) and ICU (B, right) Capacity in Arizona April 20, 2020 – December 23, 2021. |
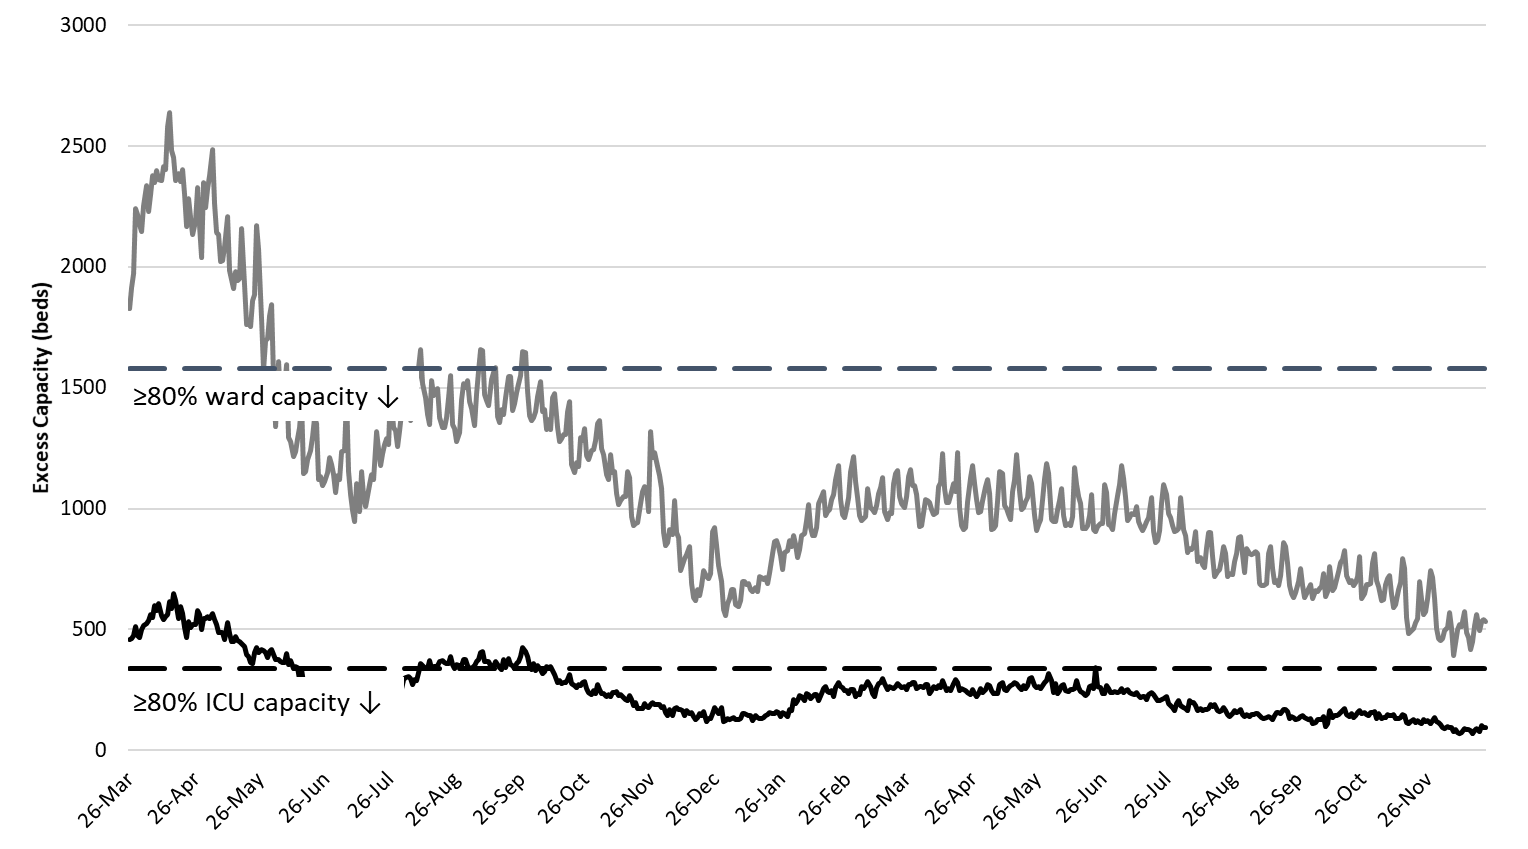
Hospital occupancy remains far above seasonal levels. Safety margins, as measured by available beds, remain at or just above historical lows (Figure 6). Hospitals should prepare for >25% ward occupancy and >35% ICU occupancy for some time.
|
Figure 6. Observed Excess Non-Surge General Ward and ICU Capacity in Arizona March 26, 2020 – Dec 17, 2021. |
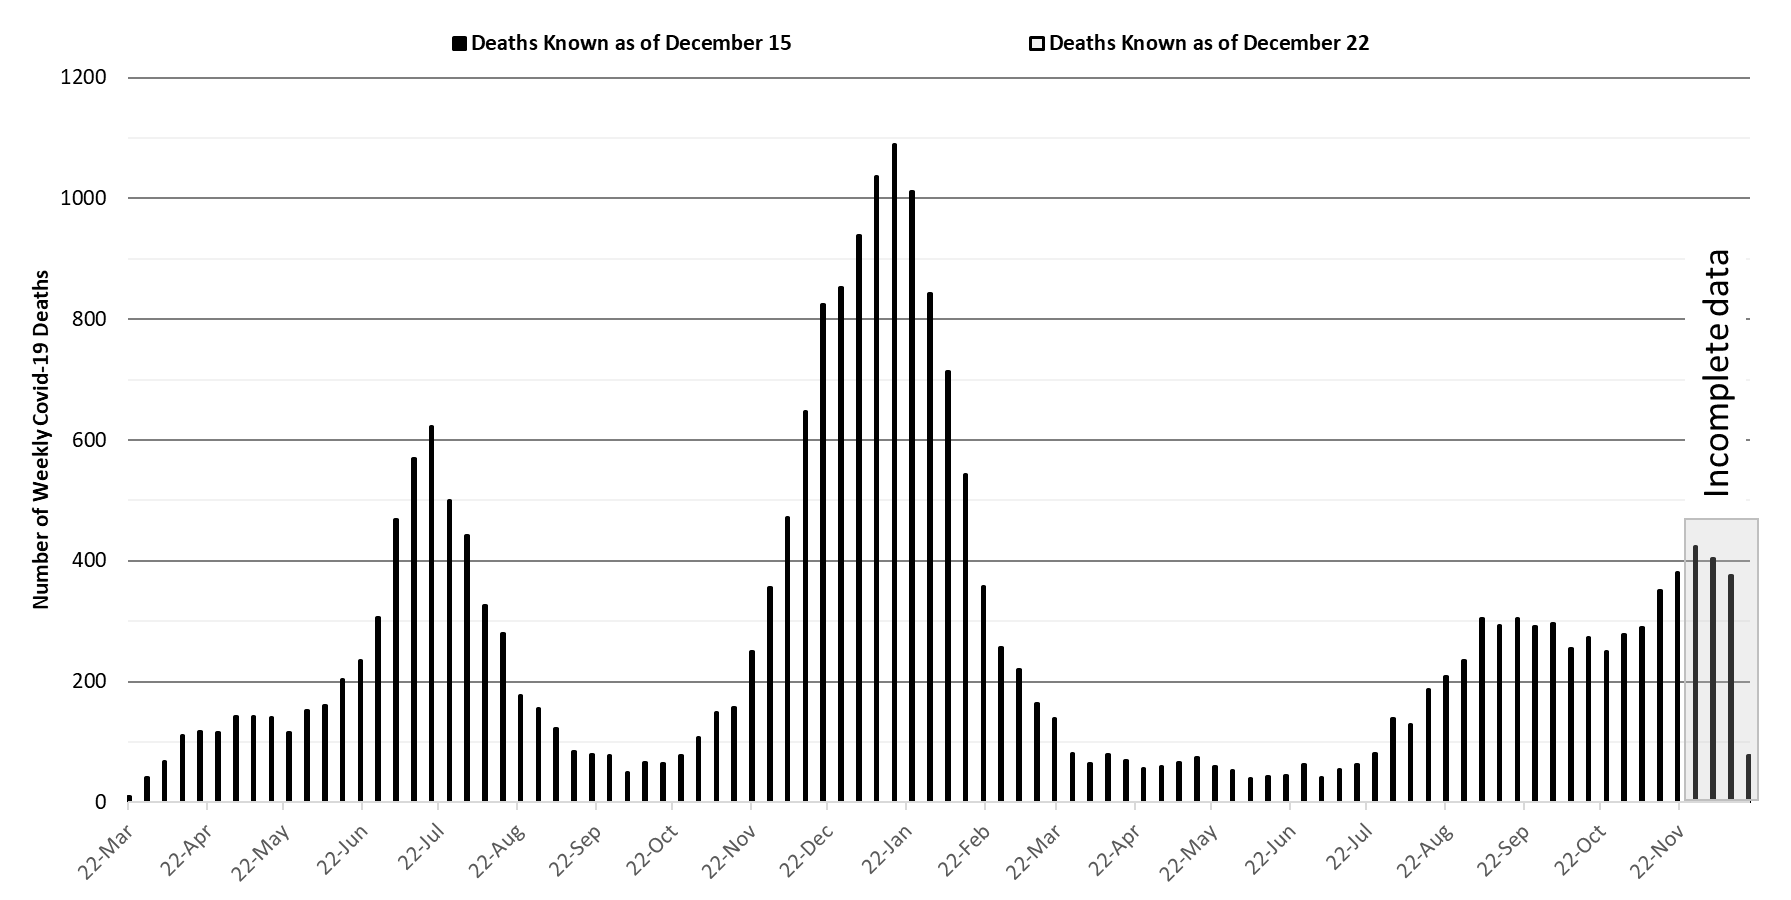
The week ending November 28th has recorded 424 deaths and the week ending December 5th has recorded 404 deaths to date (Figure 7). At least 23913 Arizonans have lost their lives to COVID-19. However, as an updated mortality report from the Arizona Public Health Association indicates, excess deaths are considerably higher than the official COVID-19 death statistics. Therefore, considerably more Arizonans have lost their lives to COVID-19 than reflected by the ADHS Dashboard.
|
Figure 7. Weekly Arizona COVID-19 Deaths March 16, 2020 – December 19, 2021. |
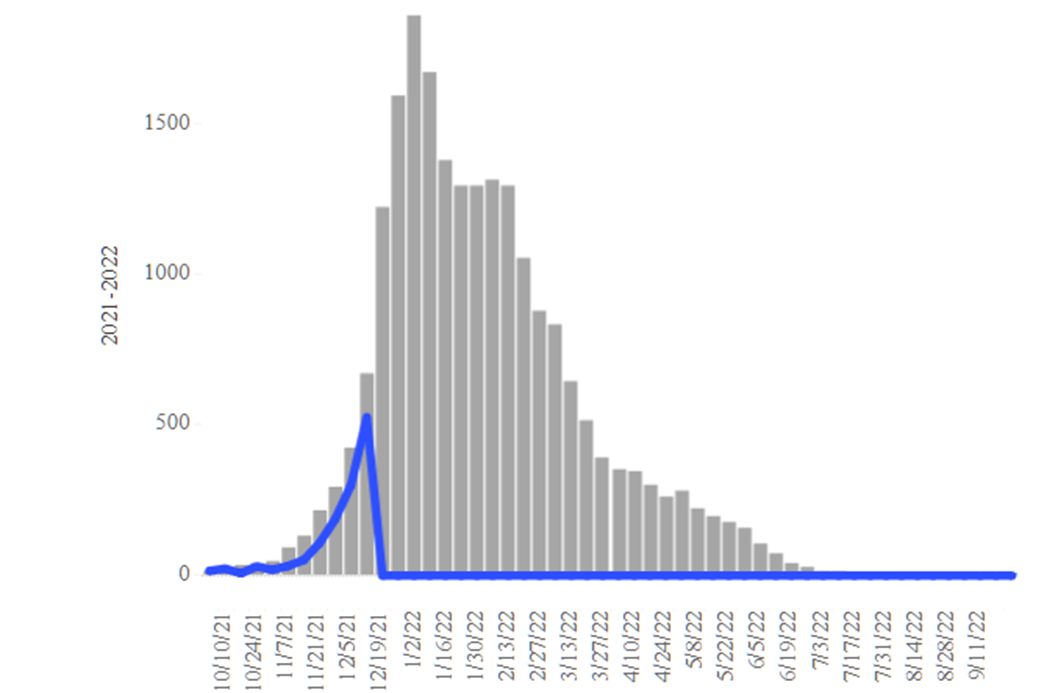
Seasonal influenza cases in Arizona (blue line) remain slightly below the 5-year historical average (grey bars, Figure 8) but even rates below historical averages could still cause a feared ‘twindemic’ in January given current levels of hospital crowding. This trend bears close observation over the next 4 – 6 weeks.
|
Figure 8. Arizona Influenza Cases in 2021 (blue) versus 5-Year Historical Average (grey). |
Pima County Outlook
For the week ending December 19th, 2841 Pima County residents were diagnosed with COVID-19, a 5% decrease from the initial tally of 3002 cases last week (Figure 9). Trends across the various age groups in Figure 10 below show generally lower transmission locally.
|
Figure 9. Weekly COVID-19 Cases in Pima County and Number of Individuals Undergoing COVID-19 Diagnostic Testing March 1, 2020 – December 19, 2021. |
|
Figure 10. COVID-19 Cases in Pima County by Age Group March 7, 2020 – December 19, 2021. (Data from week ending November 28 are suppressed). |
Summary
- Arizona continues to experience high levels of community transmission attributable to the newly dominant Omicron variant and to a lesser extent the Delta variant. Test positivity remains high reminding us that test capacity, accessibility, and/or uptake is inadequate. Given how quickly the Omicron variant impacted the United Kingdom and the US Northeast, Arizona is poised to experience another large wave of infections in January with increased hospitalizations lagging 10 – 14 days behind.
- As of December 19th, new cases were being diagnosed at a rate of 326 cases per 100K residents per week. Increasing viral transmission among those 20 – 39 years indicates that the Omicron wave is imminent.
- Mask mandates are urgently needed at municipal and county levels to reduce transmission, blunt the worst of the Omicron wave, and relieve overwhelmed hospitals. Regardless of public action, individuals should mask in indoor settings using a KN-95 or better.
- Waning vaccine immunity makes it imperative that all adults who were previously vaccinated obtain a booster, particularly those 50+ years of age.
- Risk factors for breakthrough hospitalization and death were recently elucidated in the British Medical Journal: Down’s syndrome, kidney transplantation, sickle cell disease, nursing home residents, chemotherapy, recent bone marrow or solid organ transplantation (ever), HIV/AIDS, dementia, Parkinson’s disease, neurological conditions, and liver cirrhosis. https://www.bmj.com/content/374/bmj.n2244
- ADHS and county health departments should re-open mass vaccination pods for boosters given low uptake among high-risk groups. Unfortunately, the narrow window of opportunity to mitigate/blunt the coming Omicron wave at the population level is rapidly closing or already passed. Nevertheless, there is time for some individuals to protect themselves and their families by obtaining third shot boosters.
- The United Kingdom continues to publish excellent weekly summaries of Omicron’s impact (Dec 23): https://assets.publishing.service.gov.uk/government/uploads/system/uploads/attachment_data/file/1043807/technical-briefing-33.pdf
- For those wanting to track variant data, here are links to genomic state data (https://pathogen.tgen.org/covidseq-tracker/) and national data (https://covid.cdc.gov/covid-data-tracker/#variant-proportions). S-gene Target Failure (SGTF) from PCR testing is available from the ASU Biodesign Institute: https://biodesign.asu.edu/research/clinical-testing/critical-covid-19-trends.
- COVID-19 hospital occupancy is at least temporarily declining but will continue to exceed 25% of all beds in the general ward and 35% of beds in the ICU for the remainder of the year. Access to care will continue to be restricted in the face of staff shortages in inpatient and outpatient settings.
- January is poised to be a very difficult months for Arizona hospitals as 3 events will collide: (1) the tail of the Delta wave, (2), below average but still meaningful seasonal influenza, and (3) the Omicron wave.
- Weekly COVID-19 deaths have now reached 400 per week and should remain near this level while cases exceed 20 – 25K per week. So far, 23913 Arizonans have lost their lives to COVID-19.
- As an updated mortality report from the Arizona Public Health Association indicates excess deaths are considerably higher than the official COVID-19 statistics. Considerably more Arizonans have lost their lives to COVID-19 than reflected by the ADHS Dashboard.
Forecast reports to date, available as PDFs
Download PDF to view additional charts of Arizona counties, available in appendix of report.
2020 Reports
Based on what we know now about this pandemic, we support guidelines for social distancing to slow the spread of the virus and urge everyone to follow the recommendations provided by the Centers for Disease Control and Prevention (CDC) to protect yourself, your family, your neighbors, and your employees. Please heed the recommendations as provided by the CDC.
COVID covid coronavirus virus covid19 corona forecast model

