


Note this forecast page is not the most recent forecast available.
View the most current forecast report
Researcher Analyzes Arizona COVID-19 Spread Models for Decision-Makers
The following information regarding the spread of COVID-19 in Arizona was prepared by Joe Gerald, MD, PhD, a researcher at the Mel and Enid Zuckerman College of Public Health (MEZCOPH) at the University of Arizona. This information has also been reviewed by other MEZCOPH faculty.
This data were obtained from the Arizona Department of Health Services COVID-19 webpage and reflect conditions in Arizona as of February 19, 2021.
This information is intended to help guide our response to the outbreak. It is not intended to predict how this pandemic will evolve. Rather, this model extrapolates what might occur if current conditions remain unchanged. As regional authorities and healthcare providers respond, their actions are expected to mitigate the worst consequences of this pandemic.

COVID-19 Disease Outbreak Forecast
Arizona State and Pima County
Updated February 19, 2021
Disclaimer: This information represents my personal views and not those of The University of Arizona, the Zuckerman College of Public Health, or any other government entity. Any opinions, forecasts, or recommendations should be considered in conjunction with other corroborating and conflicting data. Updates can be accessed at https://publichealth.arizona.edu/news/2021/covid-19-forecast-model.
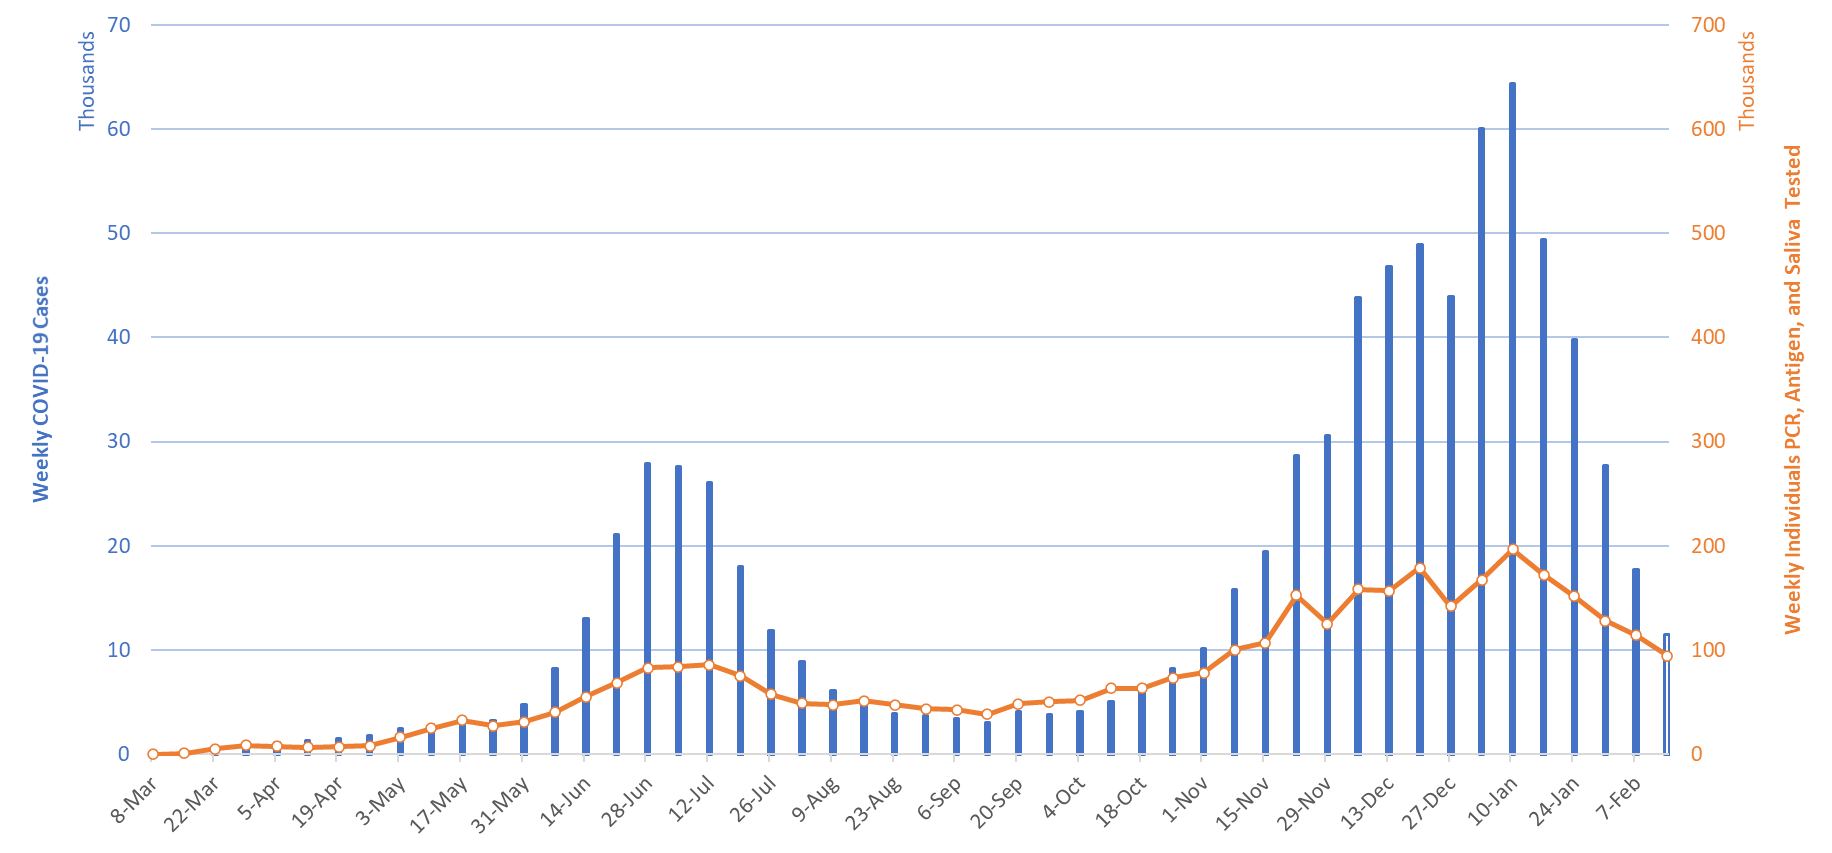
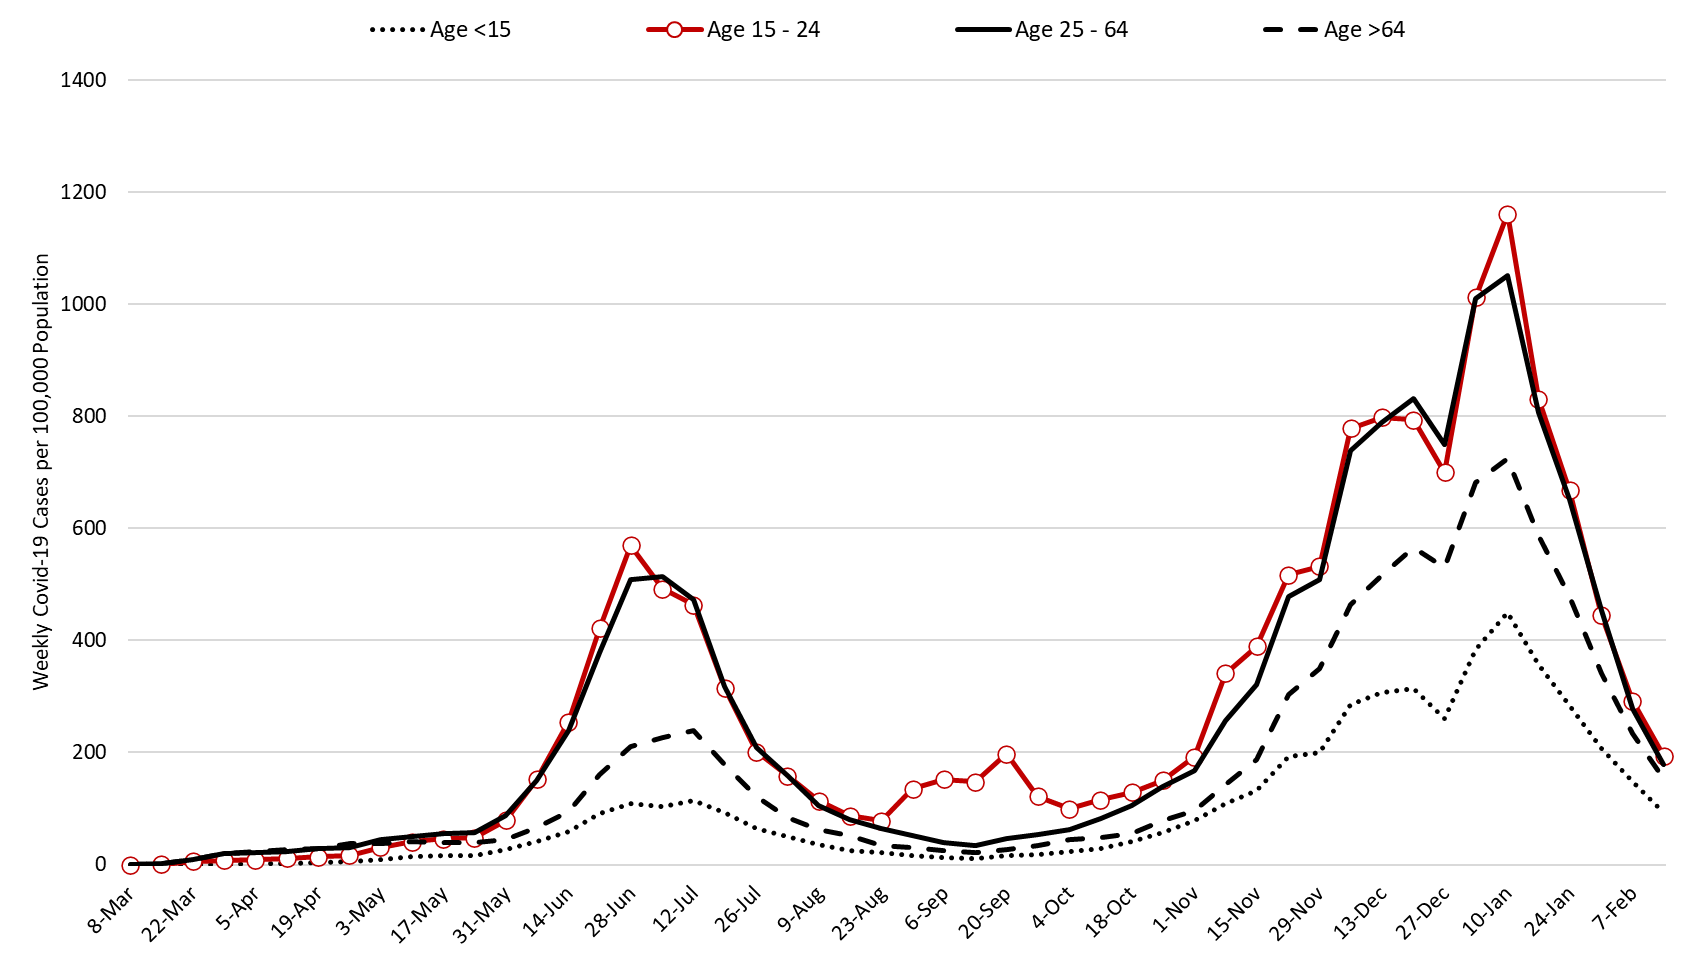
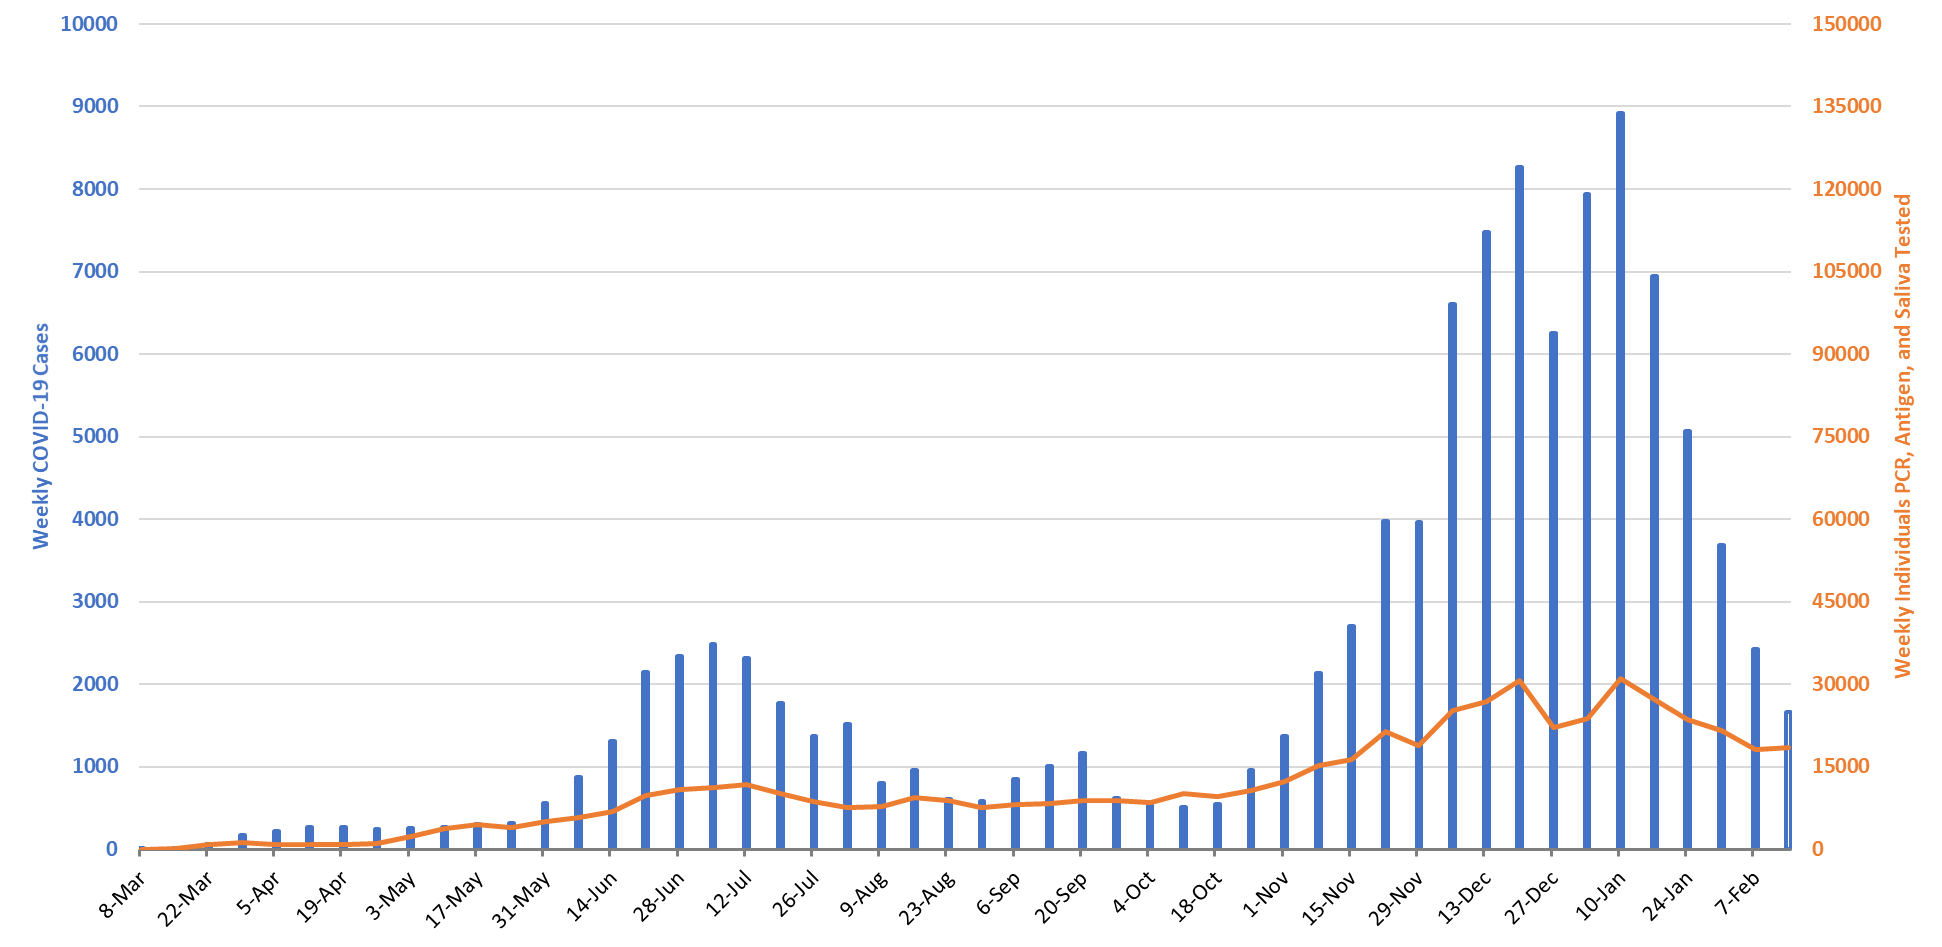
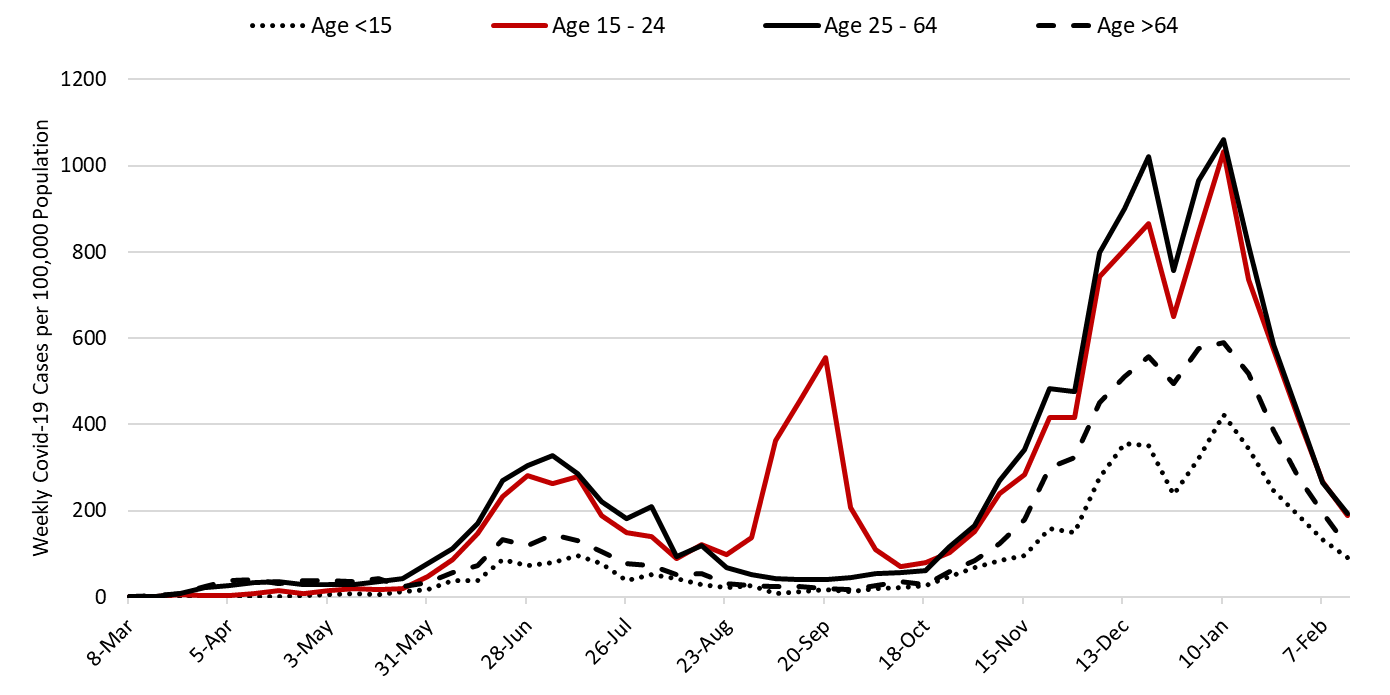
For the week ending February 14th, at least 11530 Covid-19 cases were diagnosed in Arizona (Figure 1). This represents a 35% decrease from last week’s initial tally of 17664 cases and the fifth straight week of decline. The prior week’s tally has since been upwardly revised by 1% (120 cases) to 17784 cases. The outbreak is evenly distributed by age except those <15 years of age have noticeably lower rates (Figure 2).
|
Figure 1. Newly Diagnosed Covid-19 Cases in Arizona and Number of Individuals Undergoing Covid-19 Diagnostic Testing March 1 through February 14, 2021. |
With continued declines in viral transmission and hospital occupancy, Arizona has transitioned from a period of crisis to one of elevated risk. With continuing improvements being forecast, hospital capacity will remain adequate to meet Arizona’s most critical needs. However, it will be many months before the backlog of non-Covid care is fully addressed. While residents and businesses should continue to follow the recommended public health mitigation efforts, normalization of lower risk activities will soon become reasonable as case rates fall below 100 new diagnoses per 100,000 residents per week. Arizona is now <175 per 100K per week. Those with risk factors for severe disease (e.g., age or comorbid conditions) should continue to shelter as much as feasible until fully vaccinated.
Note: Data for this report was updated Friday, February 19 allowing 4 full days to adjudicate cases and keep week-over-week backfill <10%. This allows more interpretable comparisons and graphics. All comparisons are week-over-week changes. Future updates will be released on Saturdays.
|
Figure 2. Newly Diagnosed Covid-19 Cases in Arizona by Age Group March 1 through February 14, 2021. |
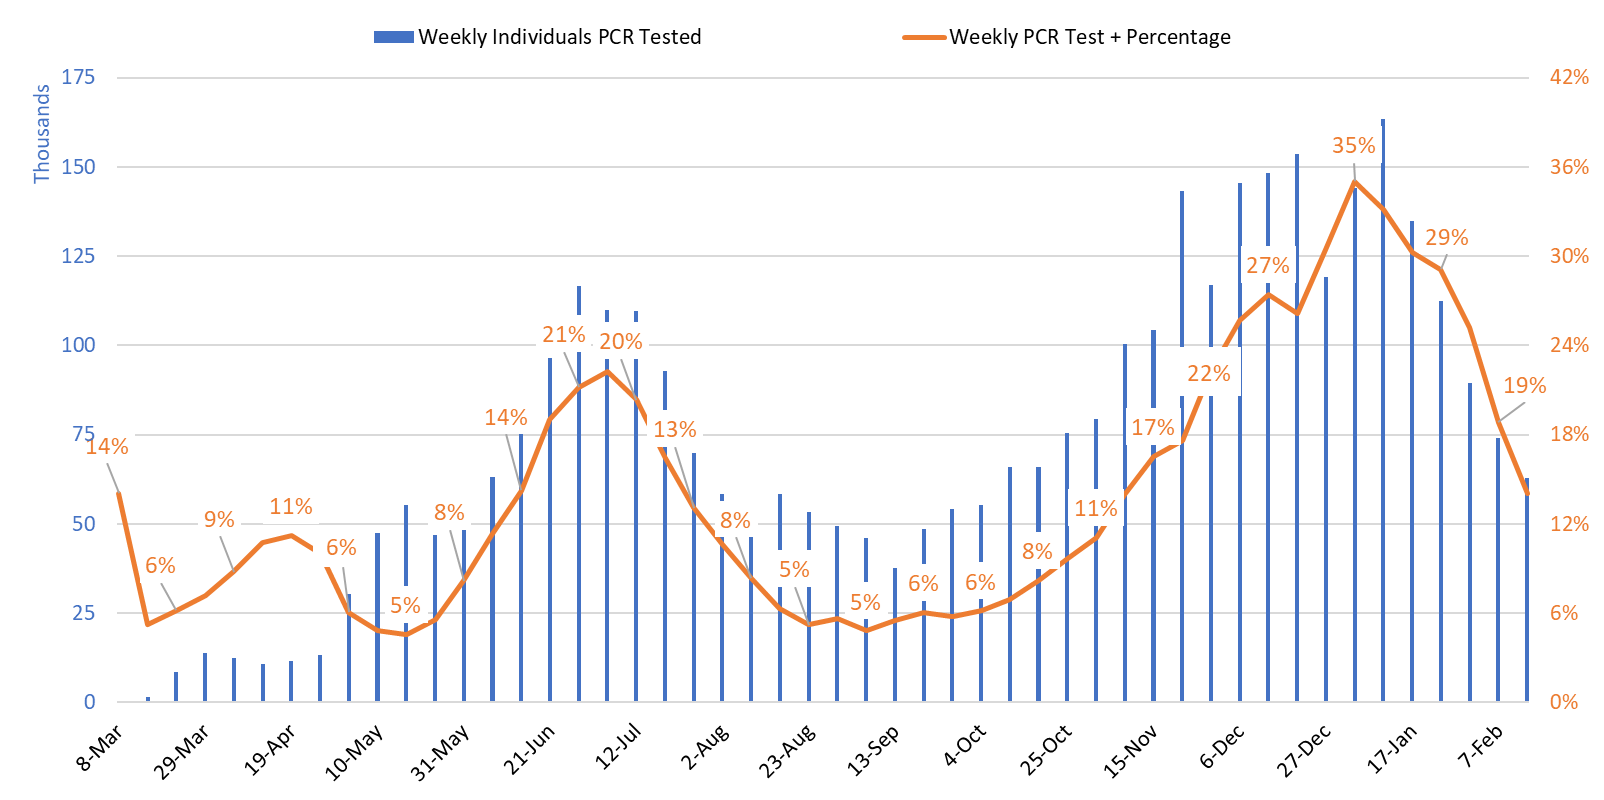
Test positivity among those undergoing traditional nasopharyngeal PCR testing decreased from 19% the week ending February 7th to 14% the week ending February 14th (Figure 3). Positivity levels still reflect inadequate testing capacity relative to optimal public health practice. Positivity should be <10%.
|
Figure 3. Weekly Number Patients Undergoing Traditional Nasopharyngeal PCR Testing and Associated Percent Positivity March 1 – February 14, 2021. |
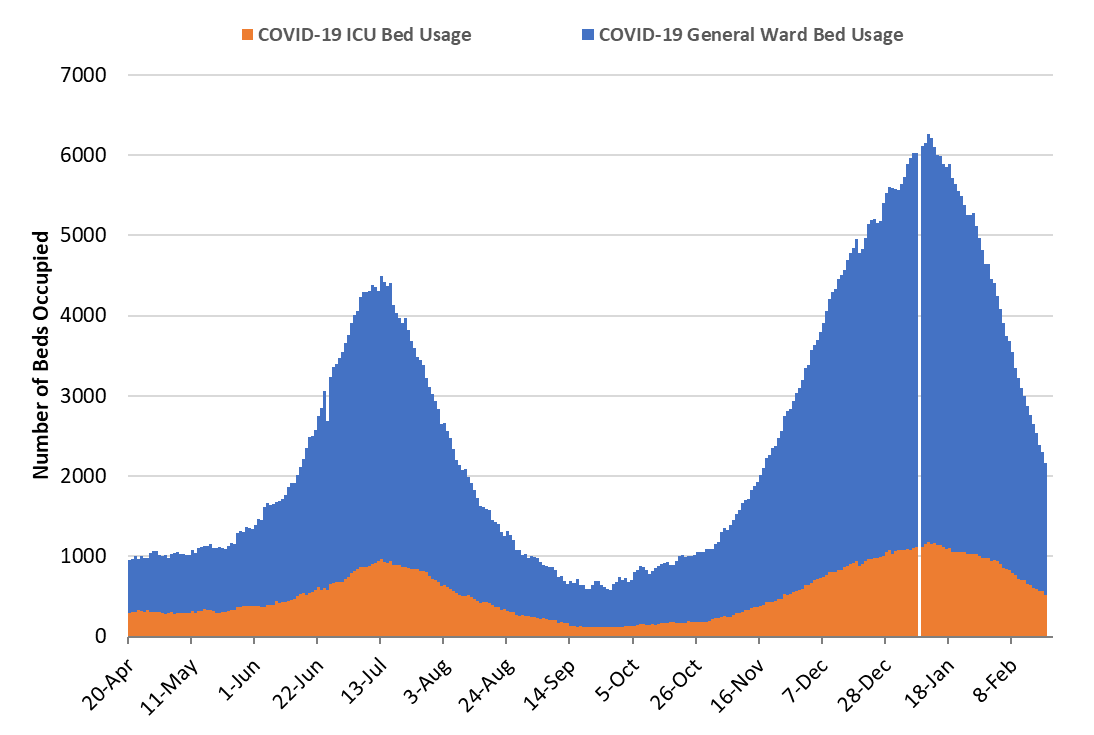
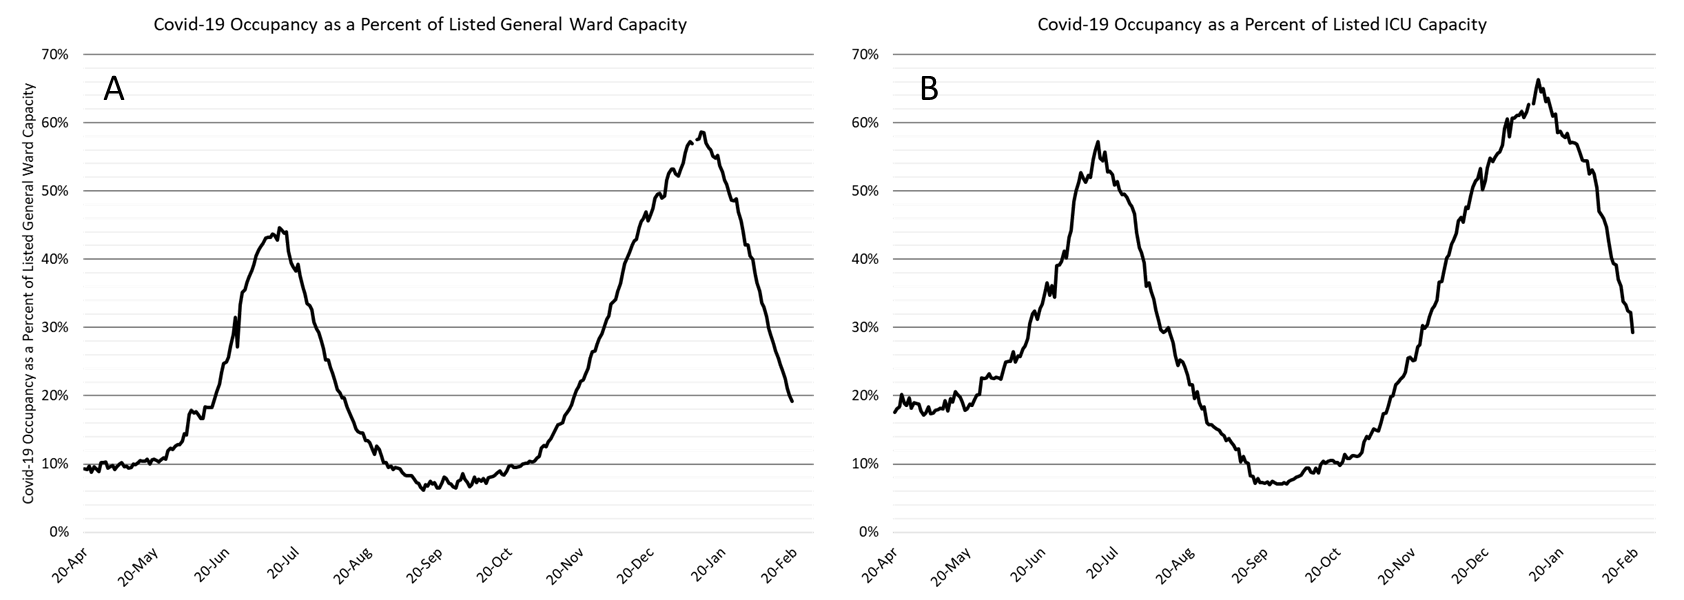
As of February 19th, 1650 (19%) of Arizona’s 8597 general ward beds were occupied by Covid-19 patients, a 28% decrease from the previous week’s 2300 occupied beds (Figure 4 and Figure 5 Panel A). Another 1039 (12%) beds remained available for use. The number of available beds is higher than the previous week’s 922 beds.
Covid-19 occupancy has dropped by 68% from its January 11th peak of 5082 ward patients. While this is good news hospitals remain far above seasonal occupancy.
|
Figure 4. Arizona Daily Covid-19 General Ward and ICU Census April 20 – February 19, 2021. |
As of February 19th, 517 (29%) of Arizona’s 1763 ICU beds were occupied with Covid-19 patients, a 26% decrease from the prior week’s count of 701 patients (Figure 4 and Figure 5 Panel B). An additional 247 (14%) ICU beds remained available for use. This is higher than the prior week’s 232 available beds. ICU occupancy has fallen 56% from its January 11th peak of 1183 occupied beds.
|
Figure 5. Covid-19 Occupancy as a Percent of Listed General Ward (A, left) and ICU (B, right) Capacity in Arizona April 20 – February 19, 2021. |
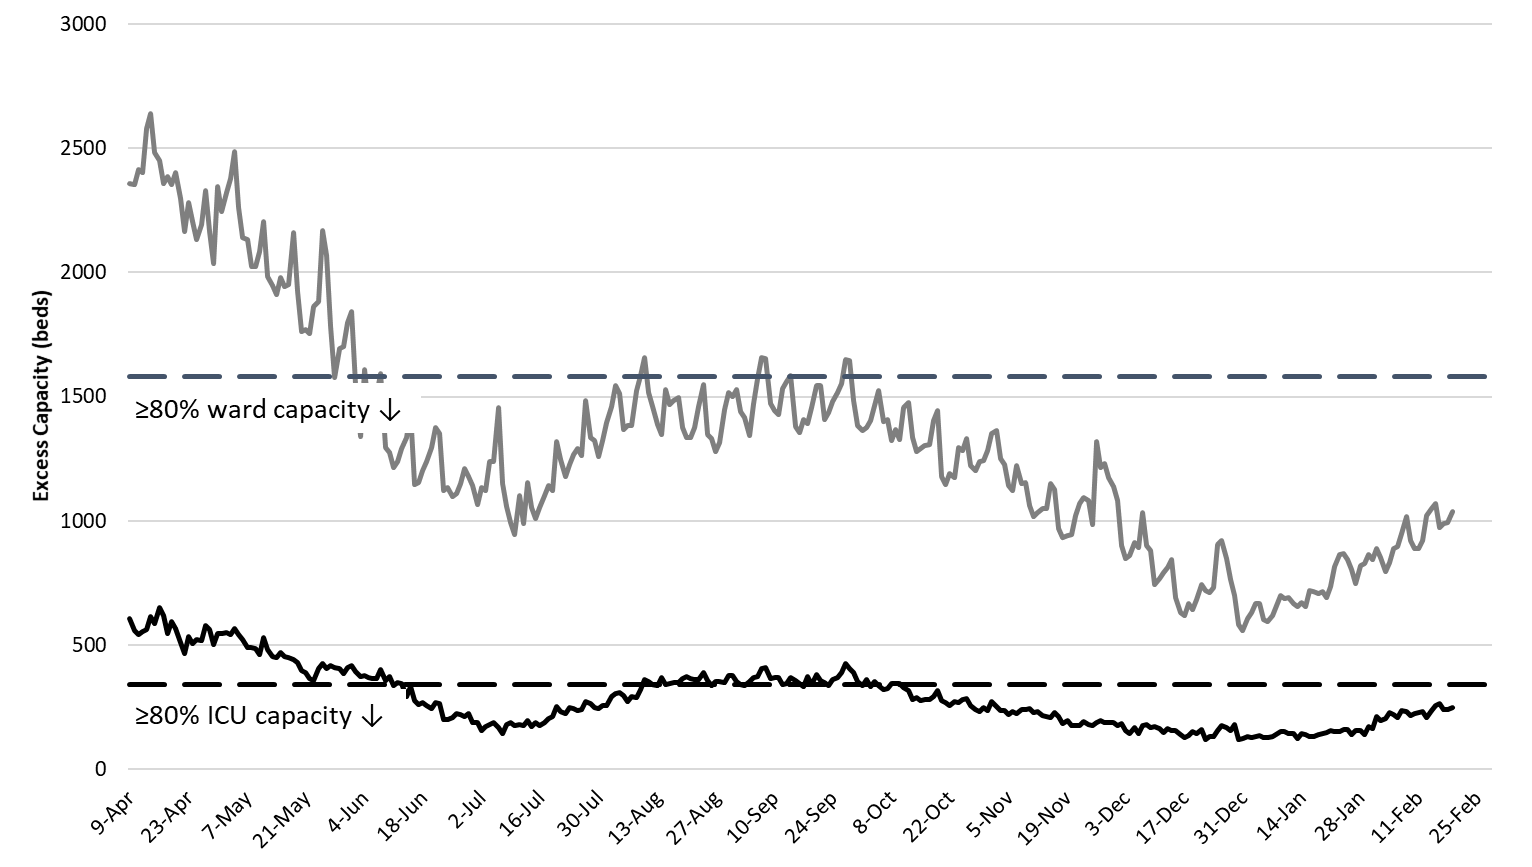
While Arizona hospitals’ safety margins remain low they are slowly improving (Figure 6, following page). Medically necessary procedures are now being scheduled in a limited capacity. Nevertheless, the tremendous backlog of postponed care will take months to resolve. The recent trends in hospitalization numbers and occupancy are encouraging. As capacity constraints are lessened, care practices should return to those prior to the outbreak ensuring all patients will receive optimal care. Nevertheless, hospitals will remain crowded through February before returning to pre-outbreak levels in early spring assuming continued reductions in viral transmission.
|
Figure 6. Observed Excess Non-Surge General Ward and ICU Capacity April 20 – February 19, 2021. |
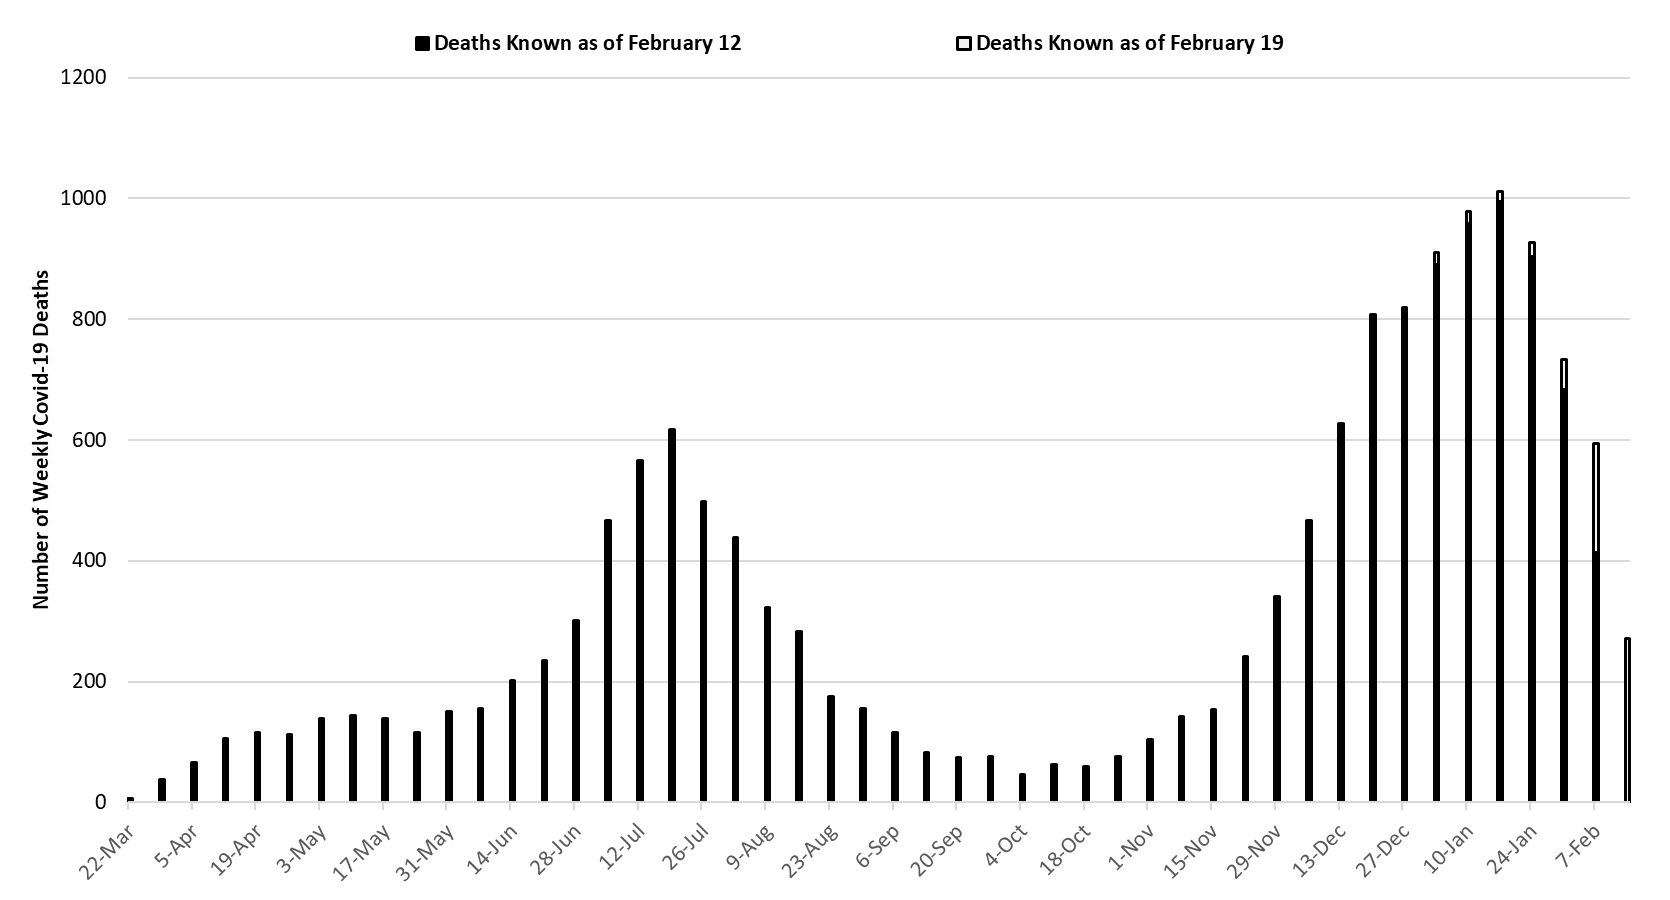
The week ending January 17th remains Arizona’s deadliest with 1011 deaths (Figure 7). The week of January 17th should represent a peak with subsequent improvement in the coming weeks. Nevertheless, Covid-19 deaths are expected to remain high for the next 3 - 5 weeks.
|
Figure 7. Weekly Arizona Covid-19 Deaths March 1 – February 14, 2021. |
Pima County Outlook
For the week ending February 14th, 1666 Pima County residents were diagnosed with Covid-19 (Figure 8). This represents a 31% decrease from the 2429 cases initially reported last week. Test capacity and/or uptake also declined from last week.
|
Figure 8. Covid-19 Cases and Individuals Undergoing Diagnostic Testing in Pima County Mar 1 – Feb 14. |
Last week’s initial tally of 2429 cases was downwardly revised by 1% (32 cases) to 2397 cases. Trends and case rates are similar across various age groups (Figure 9).
|
Figure 9. Covid-19 Cases by Age Group in Pima County from March 1 – February 14, 2021. |
Summary
- This week saw a fifth straight week of meaningful declines in Covid-19 cases and hospital occupancy. Nevertheless, absolute levels of SARS-CoV-2 viral transmission remain above the 100 new cases per 100,000 residents per week threshold which marks elevated risk.
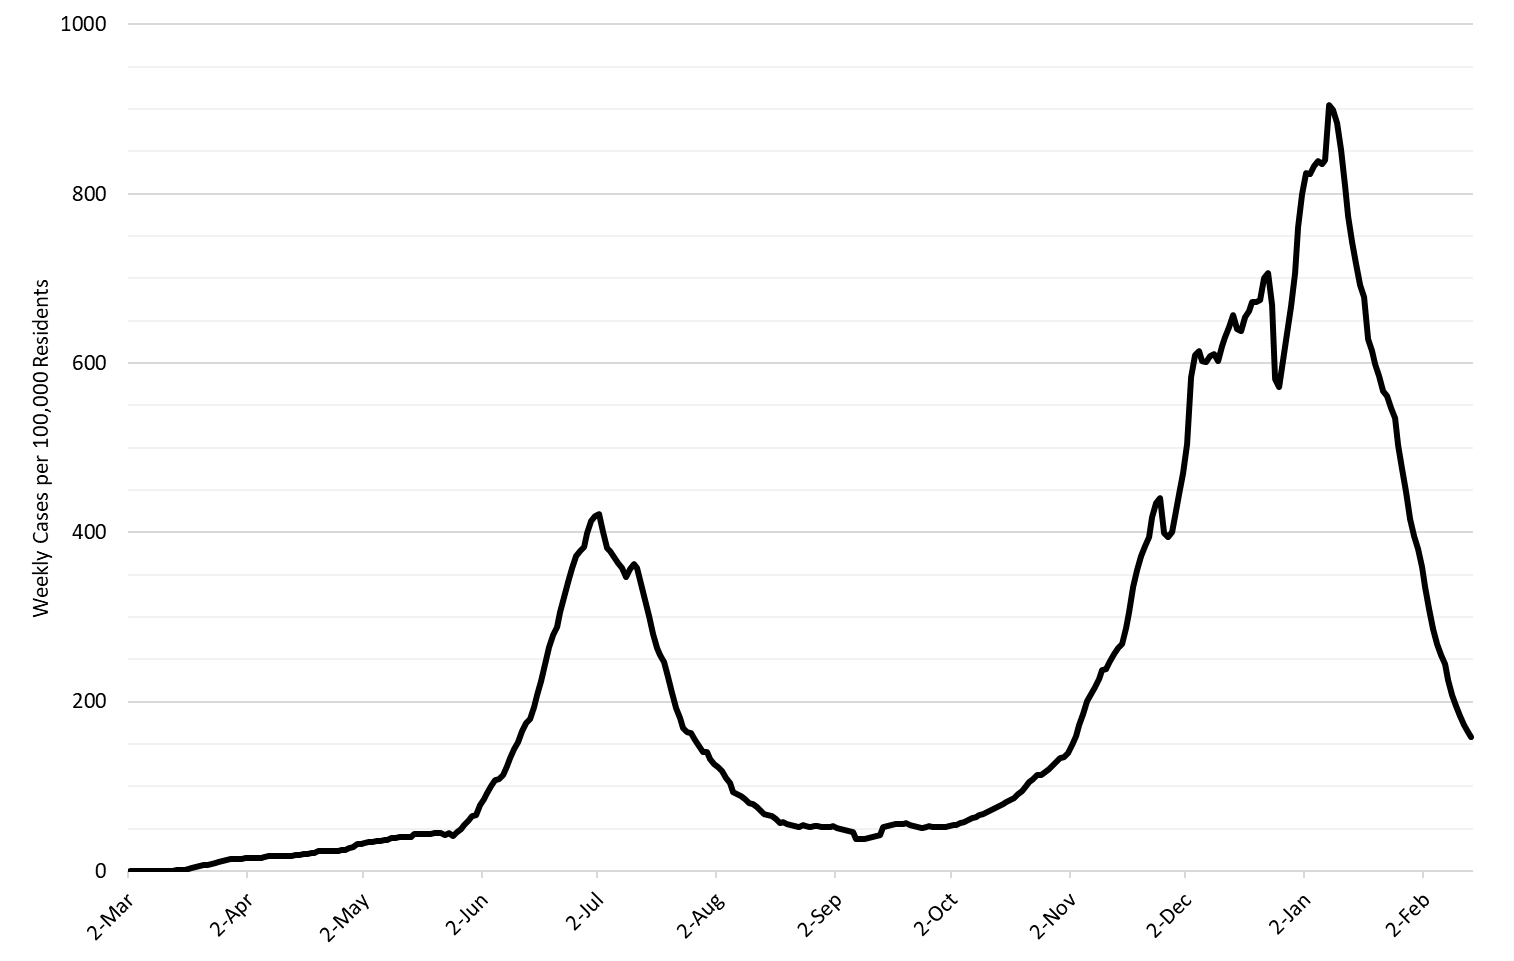
- As of February 14th, new cases were being diagnosed at a rate of 158 cases per 100,000 residents per week (Figure 10 below). This rate is declining by 86 cases per 100,000 residents per week. Despite this improvement, Arizona has the 19th highest viral transmission rate in the US according to the CDC. Overall, Arizona remains the 6th hardest hit state in terms of cases identified.
- All residents should continue to wear a mask in public, avoid social gatherings, maintain physical distance from non-household contacts, avoid >15 minutes contact in indoor spaces, especially if physical distancing is inadequate and adherence to face masks is low.
- While residents and businesses should continue to follow the recommended public health mitigation efforts, normalization of lower risk activities will be reasonable once case rates fall below 100 new diagnoses per 100,000 residents per week.
- The test positivity rate for traditional nasopharyngeal PCR testing continues to decline, falling to 14% this week. Nevertheless, testing capacity is inadequate to the scale of the problem as positivity should be <10%.
|
Figure 10. 7-Day Moving Average of Arizona Covid-19 Cases by Date of Test Collection Mar 1 – Feb 14, 2021. |
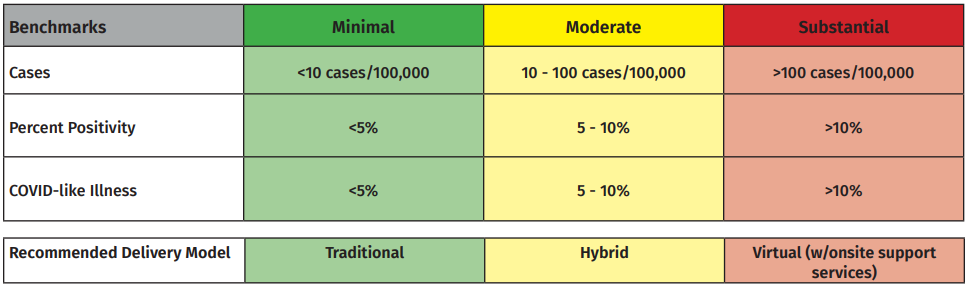
- Moving forward it will be necessary to “hold the line” on public health mitigation practices in the face of improving conditions. For example, absolute levels of transmission and test positivity remain 1.5 - 2X higher than recommended for in-person instructional activities (see Arizona Department of Health Services Benchmarks).
- Hospital Covid-19 occupancy is declining in the ward and ICU. However, access to care remains restricted with only limited numbers of medically necessary non-Covid procedures being scheduled.
- According to the CDC, 4.9% of Arizona residents have received at least 2-doses of vaccine while another 9.8% have received 1-dose. The ADHS Dashboard is reporting slightly higher levels. To date, Arizona has administered 84% of its delivered doses. Arizona vaccination roll-out ranks in the bottom half of US states.
- Many have asked about herd immunity and the risk of a spring outbreak. While I believe this winter’s outbreak will be Arizona’s largest, a smaller wave is possible this spring. However, a spring wave should it occur will pose a lesser threat as most of those at risk of hospitalization and death will have been vaccinated. For this reason, the short-term outlook remains favorable.
- NPR released a well-done simulation/animation that shows the impact of past infections, vaccinations, and increased transmissibility on future cases among remaining susceptibles.
- Arizona is still reporting a large number of weekly deaths and this count may considerably underestimate true fatalities (see Woolf, Woolf, or Weinberger). The week ending January 17th will likely be Arizona’s deadliest with >1000 deaths once all are made known. Arizona’s weekly tally of deaths ranks it 3rd in the nation. Overall, we rank 6th since the outbreak began.
- AzPHA recently released a report examining the leading causes of deaths in Arizona over time. In brief, the main finding is that Covid-19 ranks as the leading cause of death in Arizona since the pandemic began.
- The Atlantic published a thought-provoking article explaining why Covid-19 transmission has been declining over the past month. Personally, I lean towards an interaction between 1 (better self-protection) and 3 (partial immunity, particularly within some populations) as the best explanation.
Forecast reports to date, available as PDFs
Download PDF to view additional charts of Arizona counties, available in appendix of report.
2020 Reports
Based on what we know now about this pandemic, we support guidelines for social distancing to slow the spread of the virus and urge everyone to follow the recommendations provided by the Centers for Disease Control and Prevention (CDC) to protect yourself, your family, your neighbors, and your employees. Please heed the recommendations as provided by the CDC, found at the following website: https://www.cdc.gov/coronavirus/2019-ncov/prepare/prevention.html
COVID covid coronavirus virus covid19 corona forecast model

