


Note this forecast page is not the most recent forecast available.
View the most current forecast report
Researcher Analyzes Arizona COVID-19 Spread Models for Decision-Makers
The following information regarding the spread of COVID-19 in Arizona was prepared by Joe Gerald, MD, PhD, a researcher at the Mel and Enid Zuckerman College of Public Health (MEZCOPH) at the University of Arizona. This information has also been reviewed by other MEZCOPH faculty.
This data were obtained from the Arizona Department of Health Services COVID-19 webpage and reflect conditions in Arizona as of January 4, 2021.
This information is intended to help guide our response to the outbreak. It is not intended to predict how this pandemic will evolve. Rather, this model extrapolates what might occur if current conditions remain unchanged. As regional authorities and healthcare providers respond, their actions are expected to mitigate the worst consequences of this pandemic.

COVID-19 Disease Outbreak Forecast
Arizona State and Pima County
Updated January 4, 2021
Disclaimer: This information represents my personal views and not those of The University of Arizona, the Zuckerman College of Public Health, or any other government entity. Any opinions, forecasts, or recommendations should be considered in conjunction with other corroborating and conflicting data. Updates can be accessed at https://publichealth.arizona.edu/news/2021/covid-19-forecast-model.
**NOTICE** Arizona is experiencing a public health crisis where access to critical care services is limited due to shortages of space, personnel, and critical supplies. At this point, only shelter-in-place restrictions are certain to quickly and sufficiently curtail viral transmission. Because such restrictions impose substantial economic hardships, these measures should be augmented by state expansion of programs to provide direct economic assistance, reduce food insecurity, prevent foreclosure and evictions, and protect access to health services.
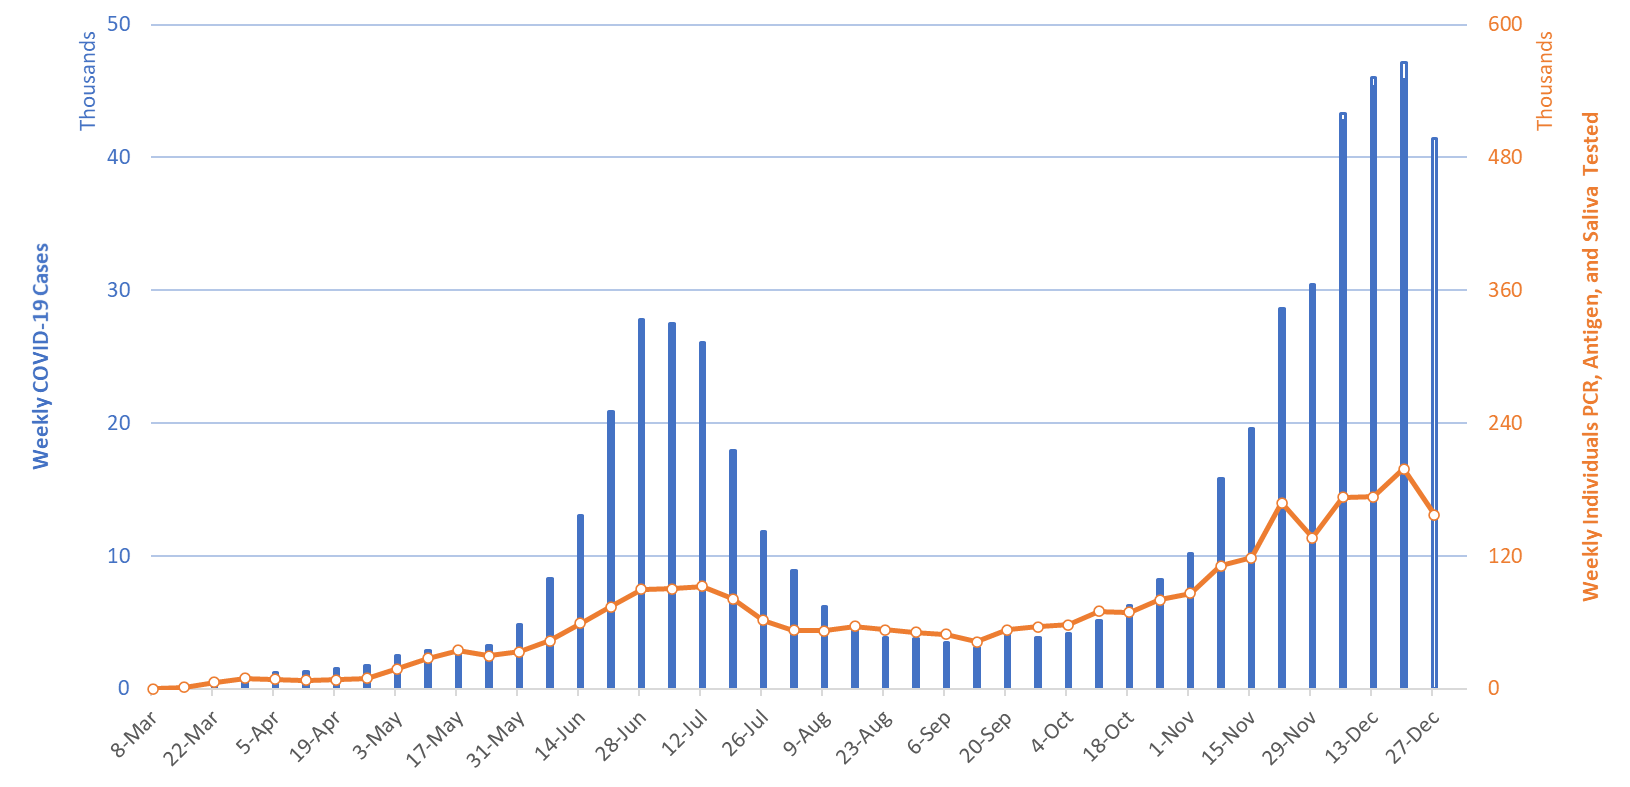
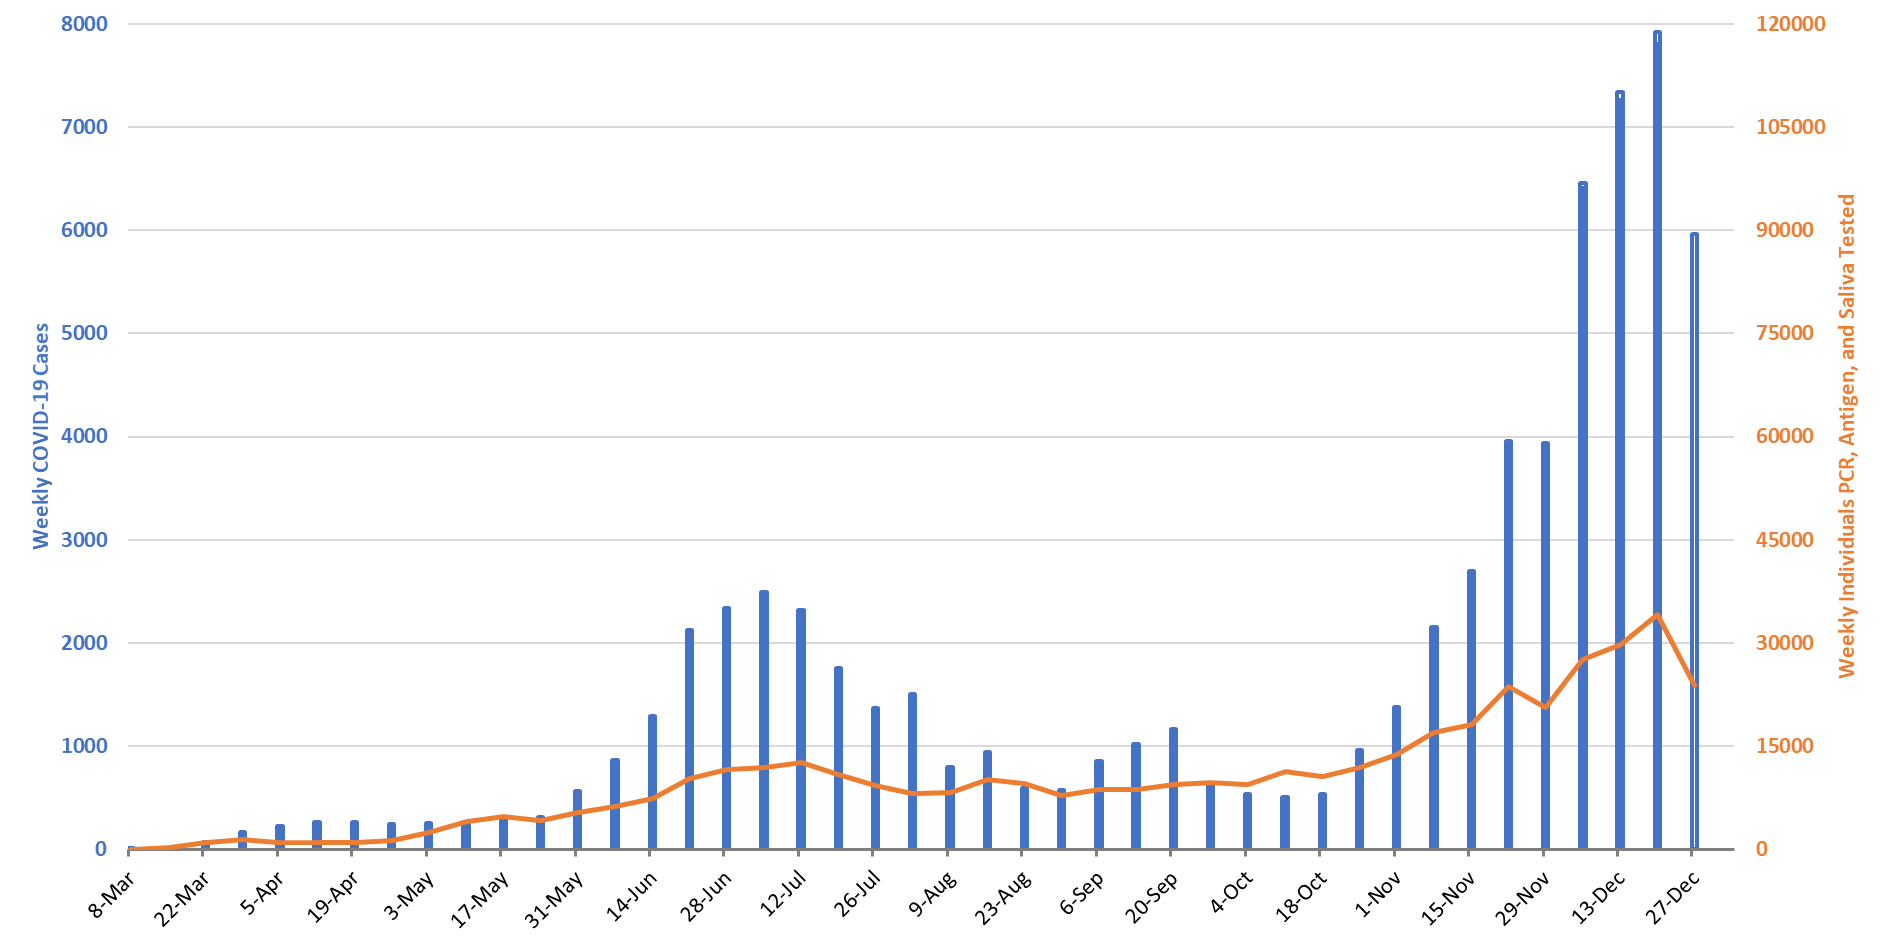
For the week ending December 27th, at least 41442 new Covid-19 cases were diagnosed in Arizona (Figure 1). This 10% decrease from last week’s initial tally of 45858 cases should be viewed skeptically owing to reduced access to or uptake of testing during Christmas. The previous week’s tally has since been upwardly revised by only 3% (1279 cases) to 47137 cases (a new single week record). Because test capacity and/or uptake declined while test positivity increased (30%), viral transmission is likely spreading faster than indicated in this report.
|
Figure 1. Newly Diagnosed Covid-19 Cases in Arizona and Number of Individuals Undergoing Covid-19 Diagnostic Testing March 1 through December 27, 2020. |
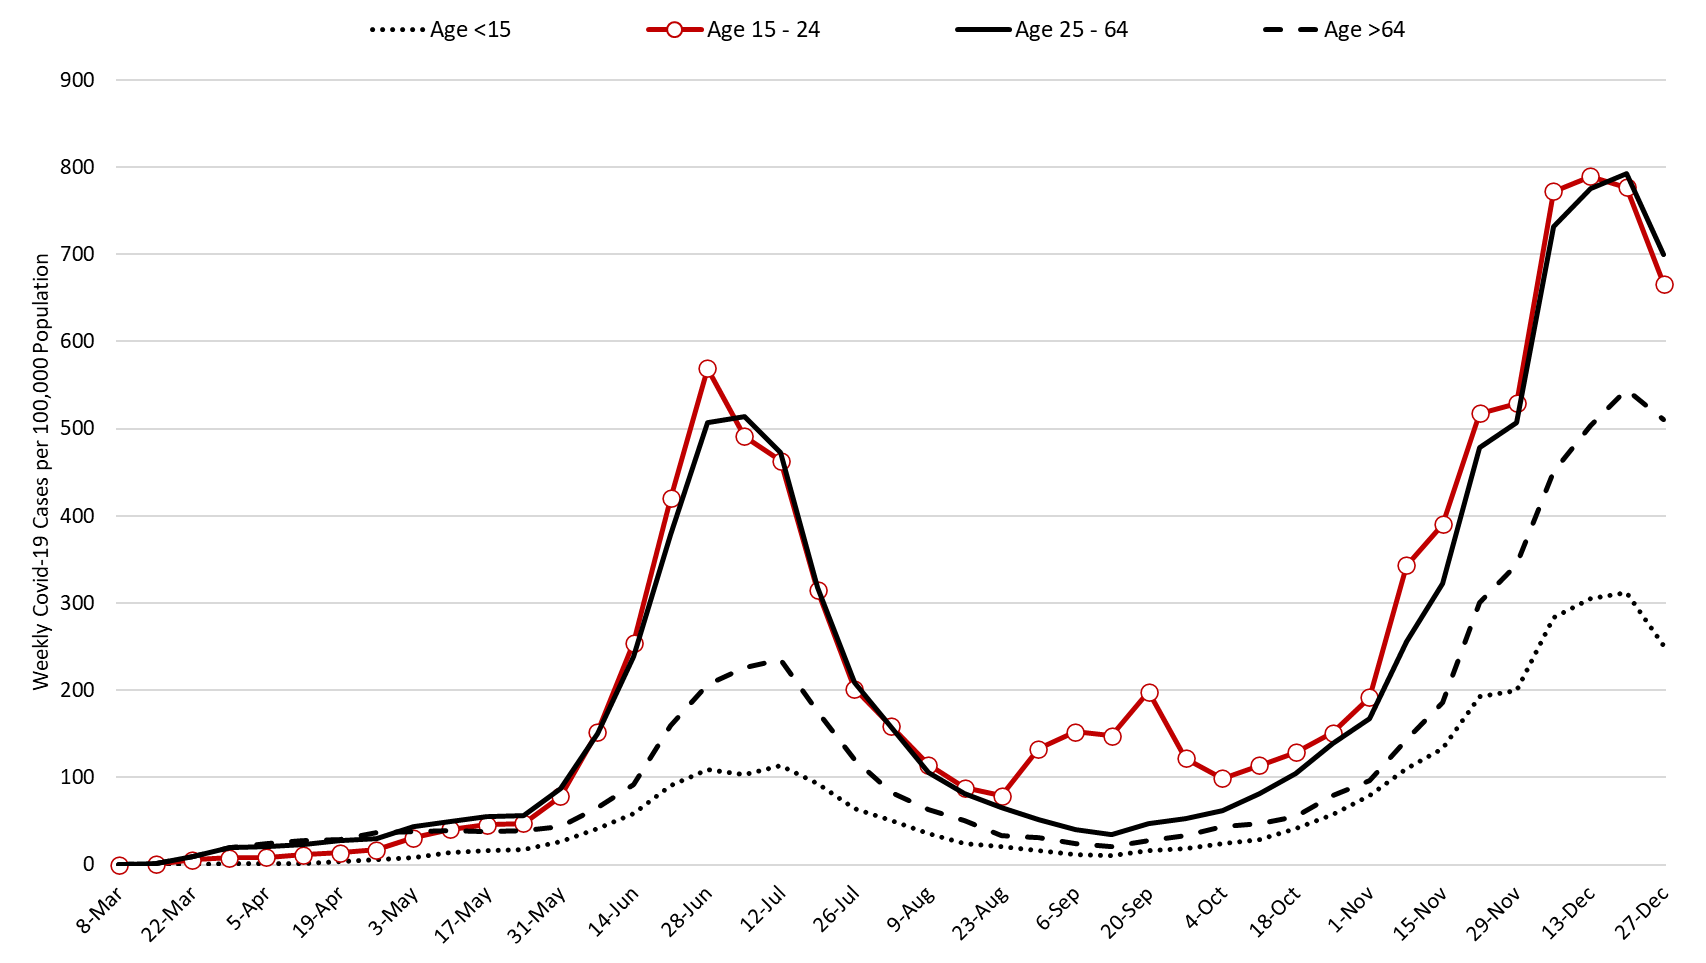
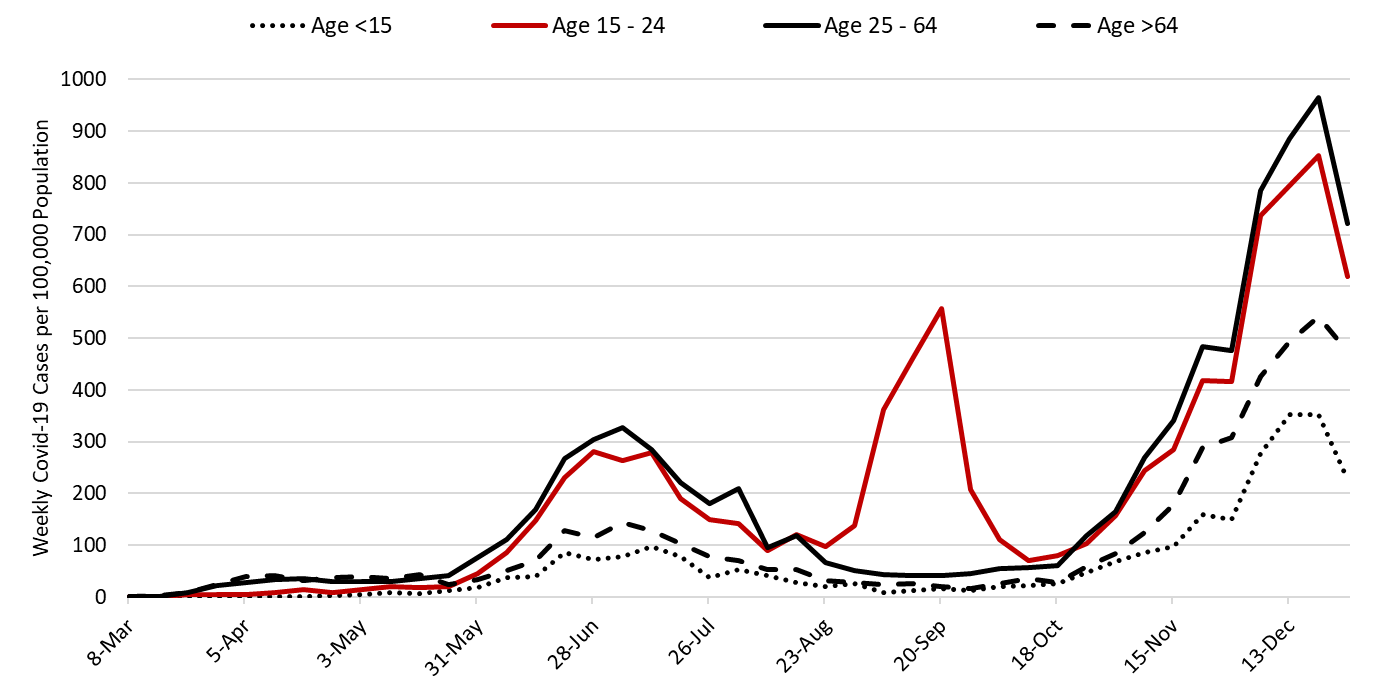
While the outbreak remains broadly entrenched, cases among those >64 years of age who are at highest risk of hospitalization, ICU admission, and mortality continues to increase relative to younger cohorts (Figure 2). For example, the proportion of total cases attributable to those >60 years of age doubled from 11% to 22% between mid-September and late-December.
Note: Data for this report was updated Monday, January 4 allowing 7 full days to adjudicate cases and keep week-over-week backfill <10%. This allows more interpretable comparisons and graphics. All comparisons are week-over-week changes. The next update will be released this Friday.
|
Figure 2. Newly Diagnosed Covid-19 Cases in Arizona by Age Group March 1 through December 27, 2020. |
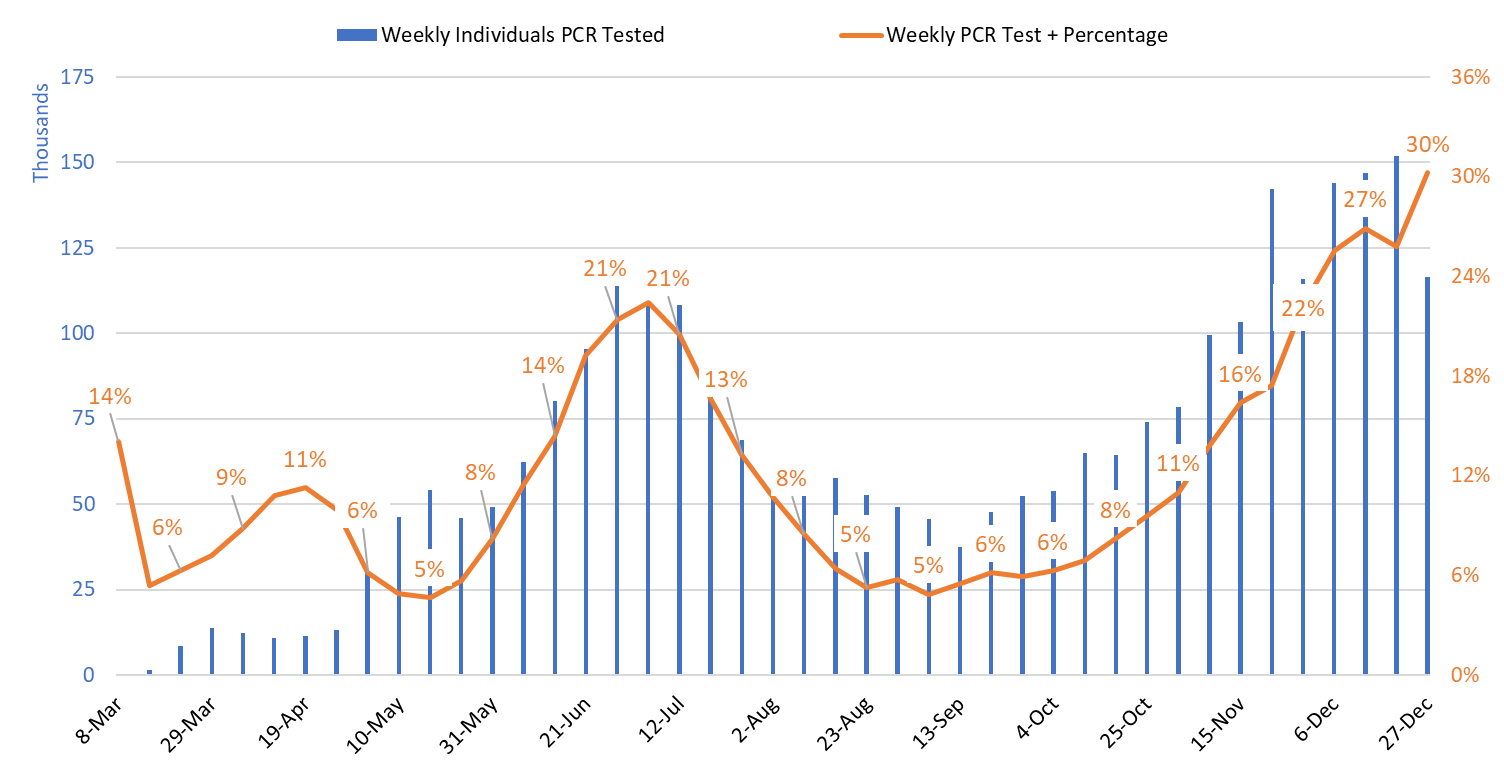
Test positivity among those undergoing traditional PCR testing increased from 26% the week ending December 20th to 30% the week ending December 27th (Figure 3). This new positivity record suggests that viral transmission is higher than indicated by the case counts alone.
|
Figure 3. Weekly Number Patients Undergoing Traditional Nasopharyngeal PCR Testing and Associated Percent Positivity March 1 – December 27. |
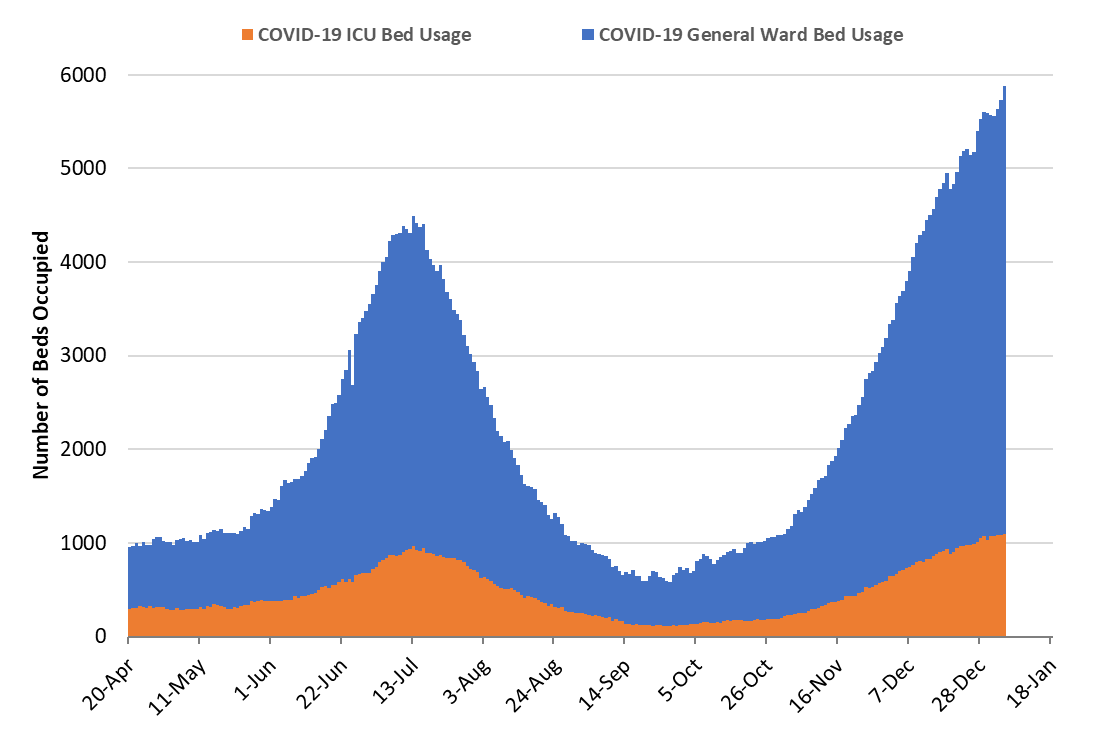
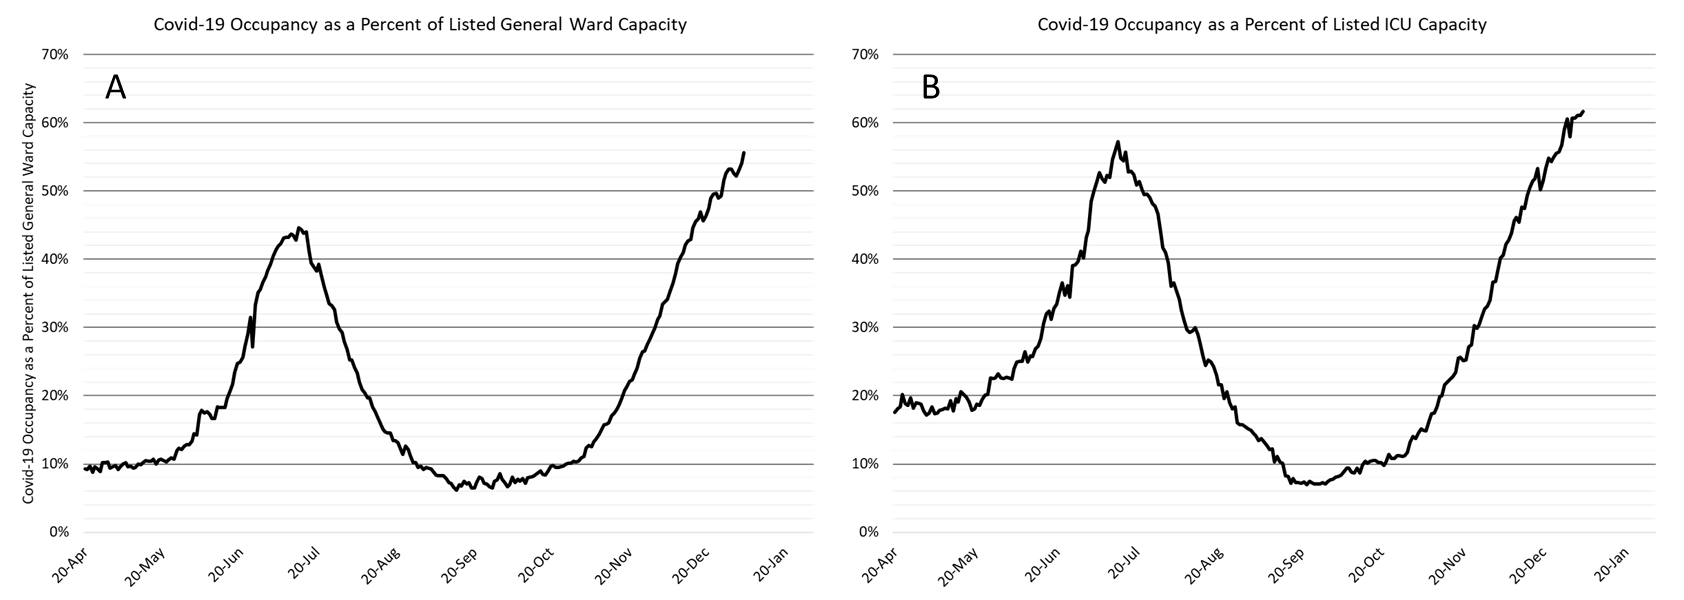
As of Jan 4th, 4789 (56%) of Arizona’s 8604 general ward beds were occupied by Covid-19 patients, a 7% increase from last week’s 4475 occupied beds (Figure 4 and Figure 5 Panel A). Another 666 (8%) beds remained available for use. The number of available beds is lower than last week’s 765 beds.
At 4789 beds and 56% occupancy, Arizona has once again established new records for ward Covid-19 patients and percent occupancy.
|
Figure 4. Arizona Daily Covid-19 General Ward and ICU Census April 20 – January 4, 2021. |
As of January 4th, 1096 (62%) of Arizona’s 1777 ICU beds were occupied with Covid-19 patients, a 4% increase from last week’s count of 1053 patients (Figure 4 and Figure 5 Panel B). An additional 136 (8%) ICU beds remain available. This is lower than last week’s 154 beds. Covid-19 occupied ICU beds and percent occupancy have never been higher in Arizona.
|
Figure 5. Covid-19 Occupancy as a Percent of Listed General Ward (A, left) and ICU (B, right) Capacity in Arizona April 20 – January 4, 2021. |
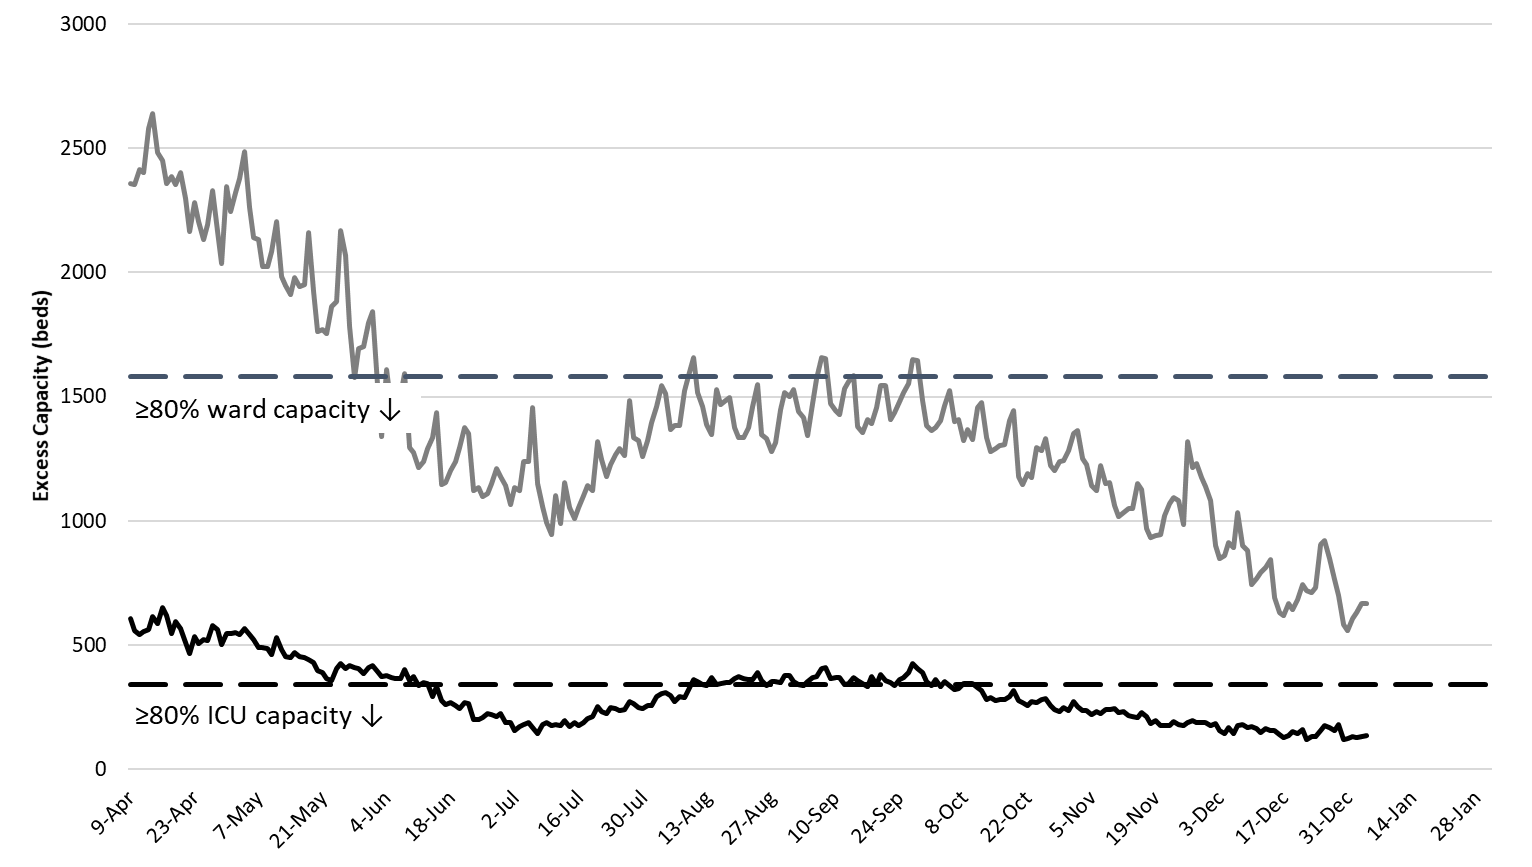
Arizona hospitals’ safety margin continues to erode in the ward and ICU (Figure 6). Most hospitals have cancelled scheduled procedures to ensure adequate capacity for patients with Covid-19 care. Arizona hospitals are now relying less on “displacement” and more on triaging by acuity of illness to maintain manageable case loads. A number of patients who would have hospitalized 4 – 8 weeks ago are now being managed in the outpatient setting. Make no mistake, the Covid-19 crisis is now placing a greater share of Arizonans’ at-risk, not just those unfortunate enough to contract Covid-19.
|
Figure 6. Observed Excess Non-Surge General Ward and ICU Capacity April 20 – January 4, 2021. |
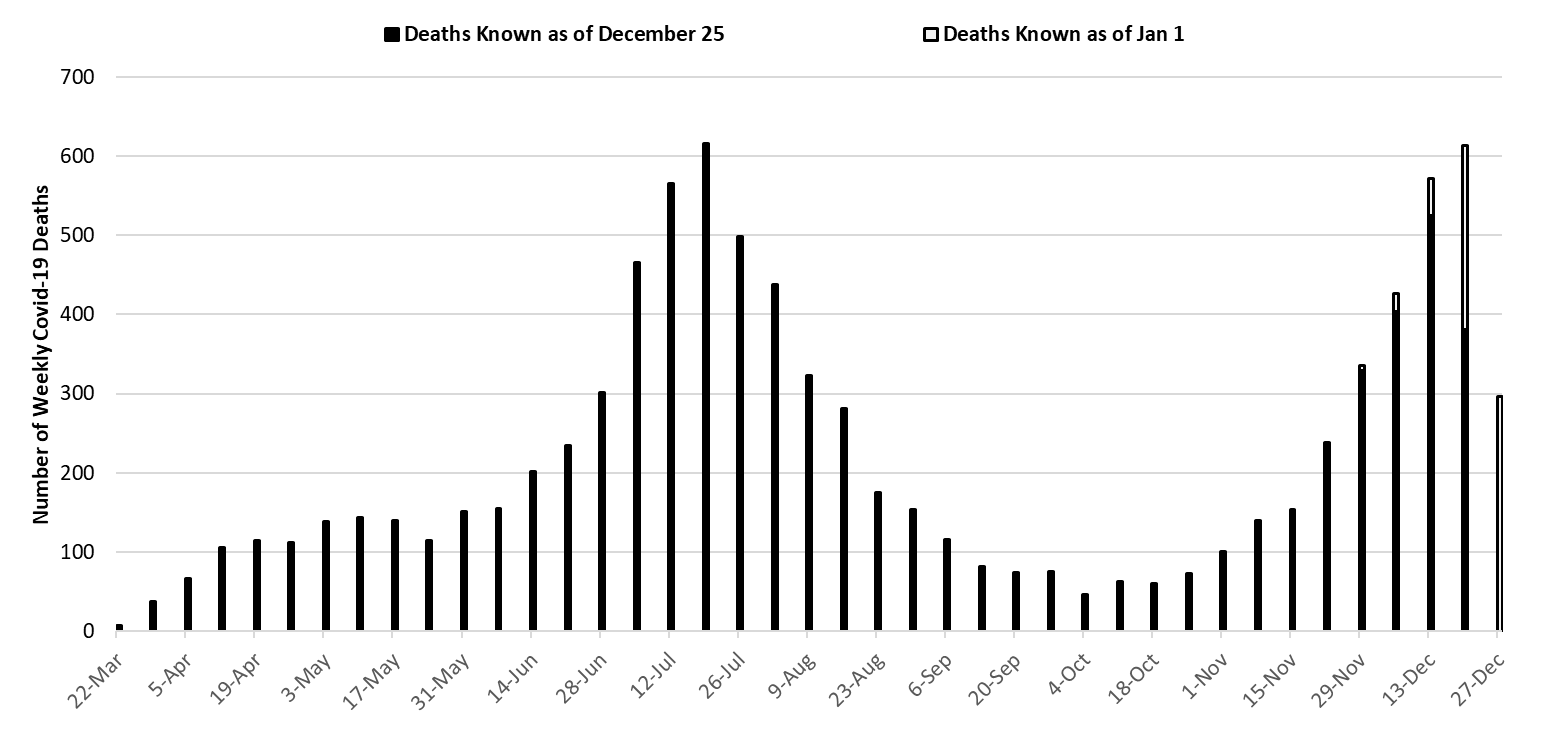
While the week ending July 19th remains Arizona’s deadliest with 617 deaths, the week ending December 20th has now recorded 613 deaths. This number will continue to increase as more deaths are made known in the coming weeks (Figure 7). Covid-19 deaths will continue to exceed 500 per week for the foreseeable future. The uniformly increasing mortality curve in Figure 7 should give us pause as it indicates that viral transmission has been steadily increasing during the holiday period despite the irregularities in case reporting.
|
Figure 7. Weekly Arizona Covid-19 Deaths March 1 – December 27, 2020. |
2021 Is Likely to Start Like 2020 Ended
Arizona has the fastest growing Covid-19 outbreak as measured by cases reported to the CDC in the past 7-days and the 11th fastest growing outbreak as measured by Arizona’s effective viral reproduction number. As described in this report, estimating viral transmission using reported cases is challenging owing to changes in testing patterns that occurred over the holiday period (Figure 8). Nevertheless, the preponderance of data indicate that viral transmission is increasing and will continue to do so in the coming weeks.
|
Figure 8. 7-day Moving Average of Number of Daily Covid-19 Cases in Arizona March 1 – December 31. |
Pima County Outlook
For the week ending December 27th, 5964 Pima County residents were diagnosed with Covid-19 (Figure 9). This represents a 24% decrease from the 7810 cases initially reported last week. However, this decline should be viewed skeptically as test reporting was sharply down during the week.
|
Figure 9. Covid-19 Cases and Individuals Undergoing Diagnostic Testing in Pima County Mar 1 – Dec 27. |
Last week’s initial tally of 7810 cases was upwardly revised by only 1% (111 cases) this week. Trends are similar across all age groups (Figure 10).
|
Figure 10. Covid-19 Cases by Age Group in Pima County from March 1 – December 27. |
Summary
- The preponderance of data indicate that viral transmission continues to increase despite the fewer number of cases reported during the week of Christmas. Reduced access to and/or uptake of testing during the holidays resulted in many cases going undiagnosed. Transmission rates are poised to accelerate further in the coming weeks. The new more transmissible UK variant that is already circulating in the US poses additional hazards as we consider the near future.
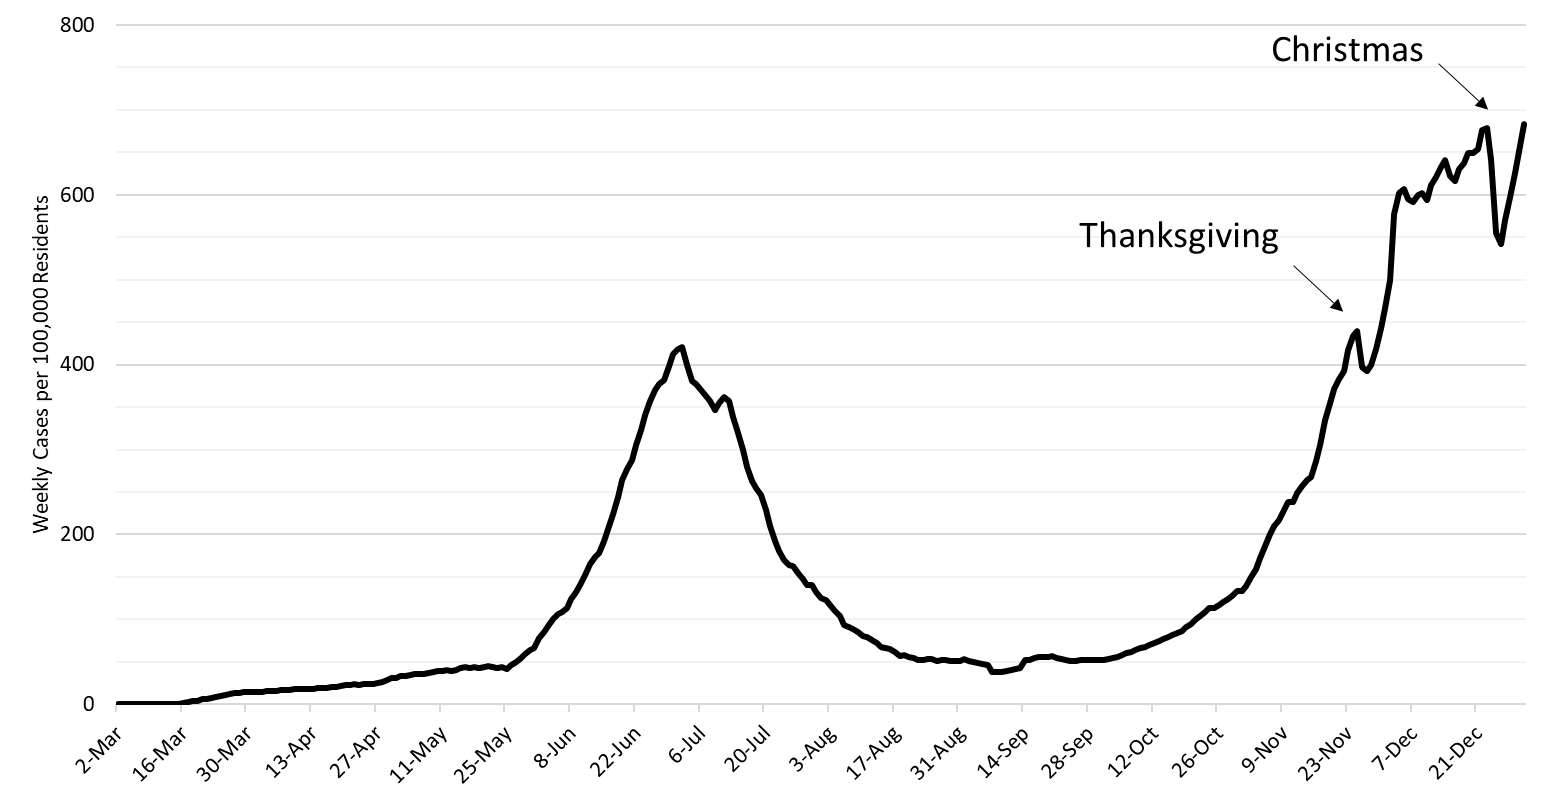
- As of December 31st, new cases were being diagnosed at a rate of at least 683 cases per 100,000 residents per week. This rate was increasing by approximately 42 cases per 100,000 residents per week.
- Since the second week in December, Arizona has been experiencing >500 Covid-19 deaths per week, many of which were preventable had the state more aggressively adopted evidenced-based public health practices.
- A state-wide shelter-in-place order remains warranted to slow transmission and to mitigate the worst of overcrowding in our hospital system. A state-wide mask mandate is also needed. Individuals and business who do not comply with restrictions should face sanctions.
- If such actions are taken, they must be accompanied by additional state funds to alleviate food insecurity, to prevent evictions and foreclosures, and to protect access to health services as the disruption of economic support between the CARES Act and the newest relief legislation will leave a small gap in benefits.
- Acknowledging that a shelter-in-place order is unlikely, counties should be granted additional authority to establish and enforce alternative Covid-19 mitigation policies.
- All Arizona residents should wear a mask in public, avoid social gatherings, maintain physical distance from non-household contacts, avoid >15 minutes contact in indoor spaces, especially if physical distancing is inadequate and adherence to face masks is low.
- Hospital Covid-19 occupancy continues to increase with each week setting new records for ward and ICU occupancy. If viral transmission continues to increase, hospitals could be overwhelmed before the end of the month. Because many of the hospital coping mechanisms are hidden from view, it is likely that they will appear to fail abruptly and with little warning from the public’s perspective.
- Hospitals continue to postpone scheduled procedures to create additional capacity for Covid-19 patients at the expense of others with serious medical conditions. This coping mechanism could be exhausted soon if admissions continue to increase.
- Health professionals are being asked to work additional hours and assume new duties. Shortages and burn-out will degrade our capacity to provide critical care services over the coming weeks.
- The test positivity rate for traditional nasopharyngeal PCR testing set a new record this week at 30% positivity. This indicates a substantial mismatch between testing capacity and demand and supports the notion that viral transmission is growing faster than case counts alone would suggest.
Forecast reports to date, available as PDFs
Download PDF to view additional charts of Arizona counties, available in appendix of report.
January 4
2020 Reports
Based on what we know now about this pandemic, we support guidelines for social distancing to slow the spread of the virus and urge everyone to follow the recommendations provided by the Centers for Disease Control and Prevention (CDC) to protect yourself, your family, your neighbors, and your employees. Please heed the recommendations as provided by the CDC, found at the following website: https://www.cdc.gov/coronavirus/2019-ncov/prepare/prevention.html
COVID covid coronavirus virus covid19 corona forecast model

