


Note this forecast page is not the most recent forecast available.
View the most current forecast report
Researcher Analyzes Arizona COVID-19 Spread Models for Decision-Makers
The following information regarding the spread of COVID-19 in Arizona was prepared by Joe Gerald, MD, PhD, a researcher at the Mel and Enid Zuckerman College of Public Health (MEZCOPH) at the University of Arizona. This information has also been reviewed by other MEZCOPH faculty.
This data were obtained from the Arizona Department of Health Services COVID-19 webpage and reflect conditions in Arizona as of September 10, 2021.
This information is intended to help guide our response to the outbreak. It is not intended to predict how this pandemic will evolve. Rather, this model extrapolates what might occur if current conditions remain unchanged. As regional authorities and healthcare providers respond, their actions are expected to mitigate the worst consequences of this pandemic.

COVID-19 Disease Outbreak Forecast
Arizona State and Pima County
Updated September 10, 2021
Disclaimer: This information represents my personal views and not those of The University of Arizona, the Zuckerman College of Public Health, or any other government entity. Any opinions, forecasts, or recommendations should be considered in conjunction with other corroborating and conflicting data. Updates can be accessed at https://publichealth.arizona.edu/news/2021/covid-19-forecast-model.
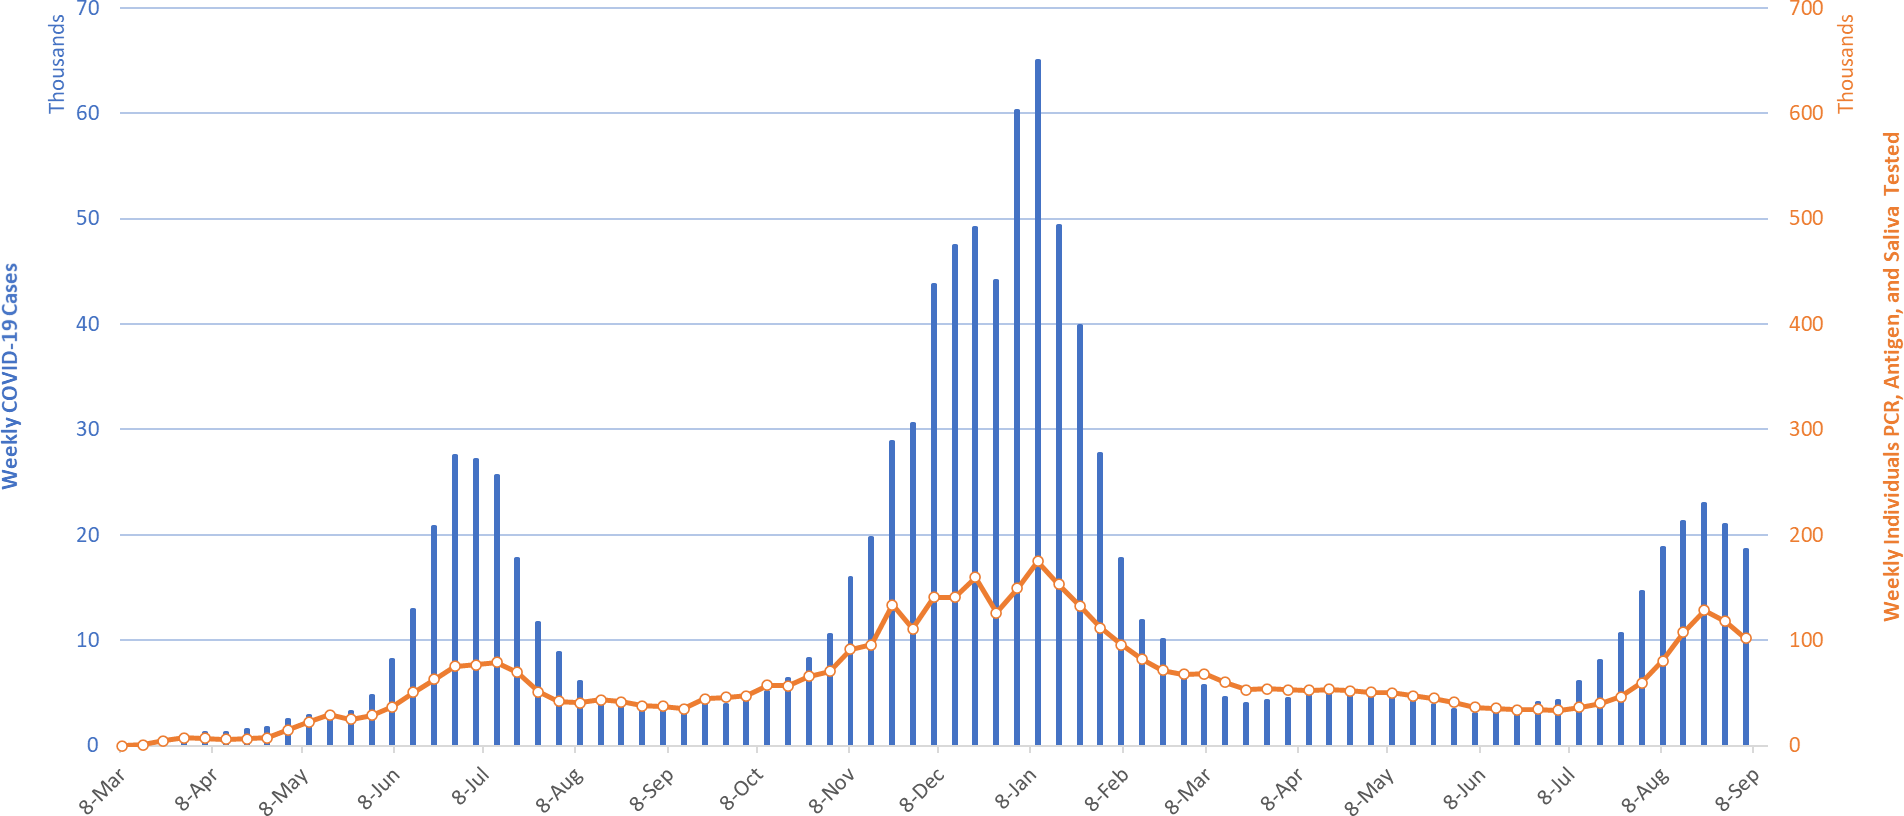
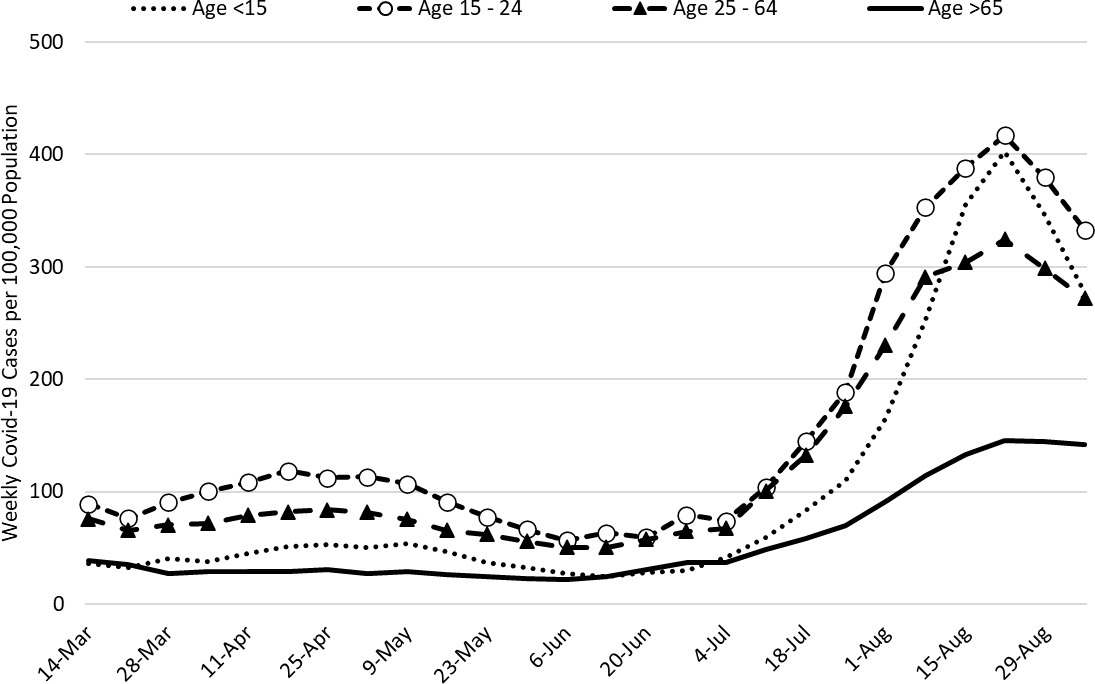
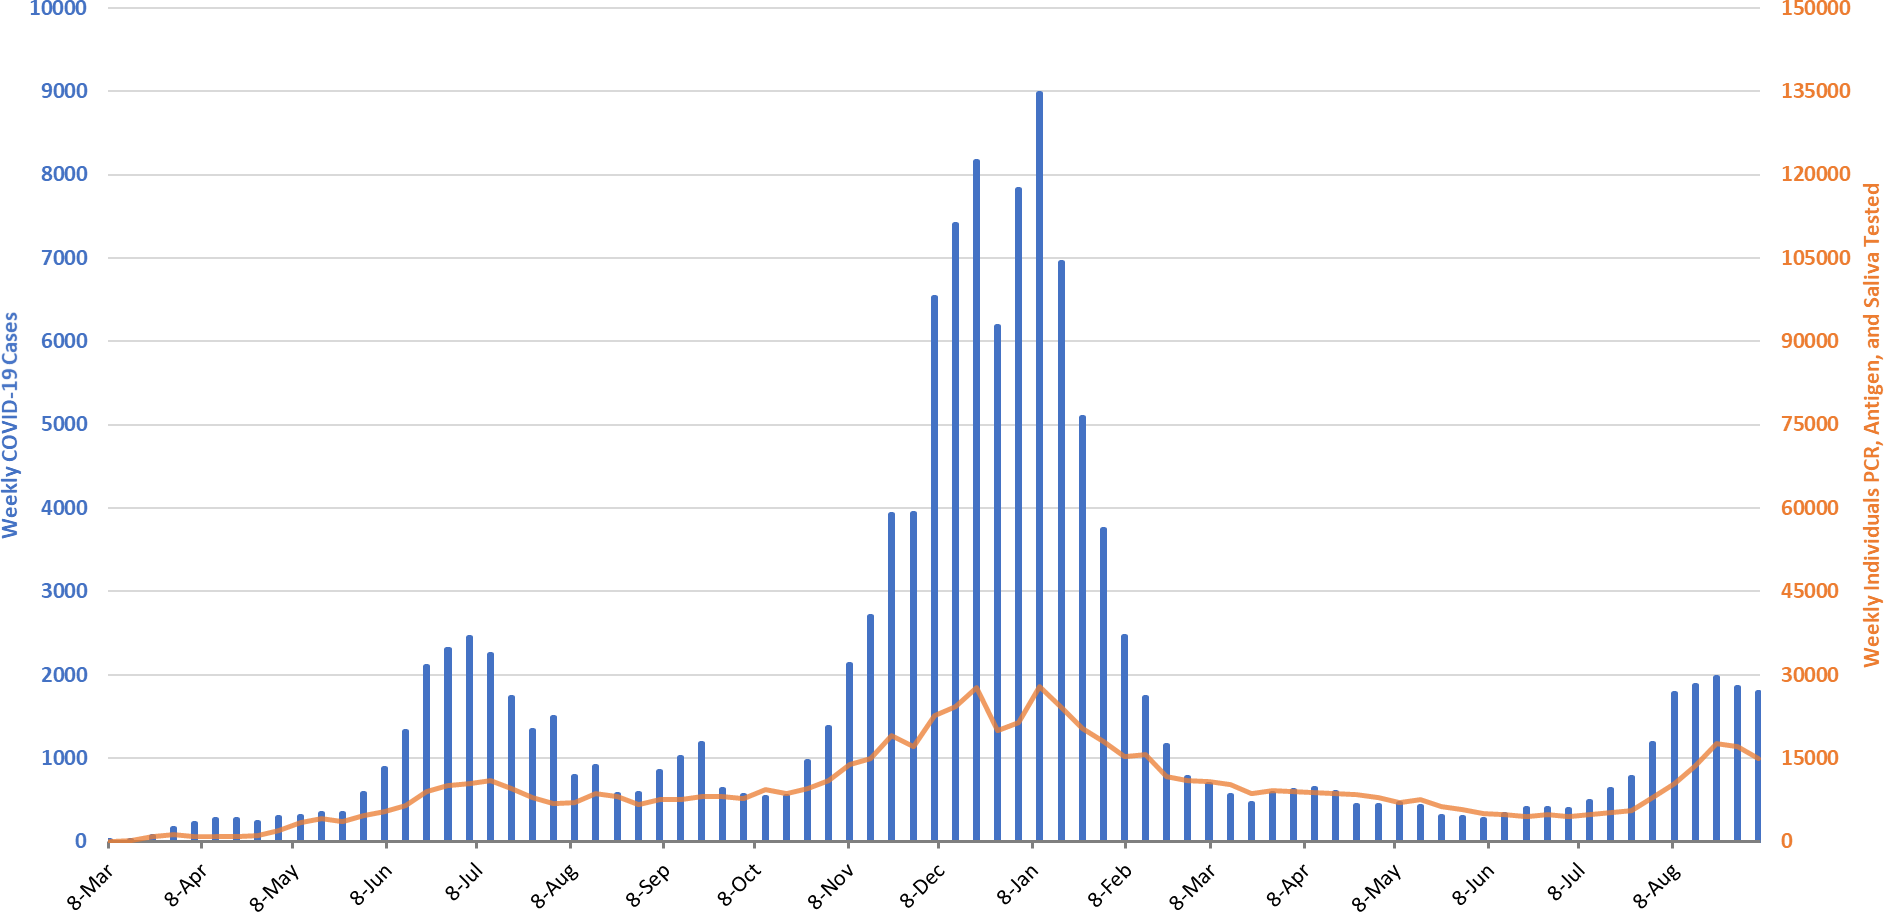
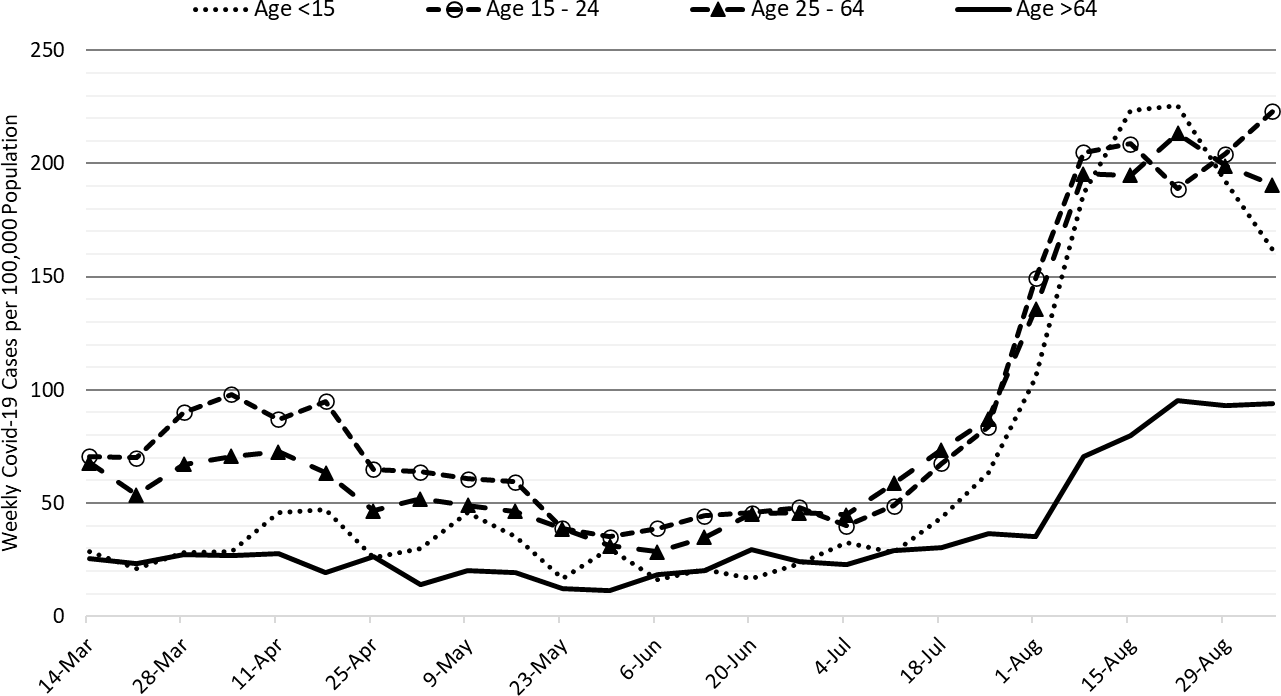
For the week ending September 5th, 18565 Arizonans were diagnosed with COVID-19 (Figure 1). The current rate, 259 cases per 100K residents per week, is decreasing by 32 cases per 100K residents per week. This is a 19% decline from a peak of 318 cases per 100K residents observed on August 21st. Case rates remain highest among those 15 – 24 years and lowest among those >65 years, 333 versus 142 cases per 100K residents, respectively (Figure 2a below). Over the past 2 weeks, the largest improvements have been observed among children with rates declining 31% from their peak.
|
Figure 1. Weekly COVID-19 Cases in Arizona and Number of Individuals Undergoing COVID-19 Diagnostic Testing March 1, 2020 – September 5, 2021. |
While Arizona continues to experience a high number of cases, hospitalizations, and deaths, conditions are generally improving except for a handful of counties. Because behavioral dynamics are an important driver of community transmission, this recent improvement could be disrupted in the wake of the Labor Day weekend. Arizona’s national ranking is holding steady at 26th out of 50 states with this week’s leaders being South Carolina (645), Kentucky (621), West Virginia (592), Alaska (580), and Wyoming (558). While Arizona’s overall ranking has dropped from 6th to 13th in cases per capita, it continues to hold down 6th place in deaths per capita.
According to the CDC, 60% of Arizona’s adult population is fully vaccinated and another 10% have received one dose. The ADHS Vaccine Dashboard shows weekly doses delivered are once again declining with 90K doses per being administered last week. Based on national serology data, the combination of natural and vaccine immunity likely exceeds 80% in most parts of the country and among most age groups. Nevertheless, non- pharmacologic interventions like mask mandates, limited gathering sizes, and targeted business mitigations are still needed to speed resolution and ensure this wave does not reignite. In another major development, President Biden announced plans to require many federal workers to get vaccinated and require large private employers to vaccinate their workers, require weekly COVID-19 testing, or face monetary penalties.
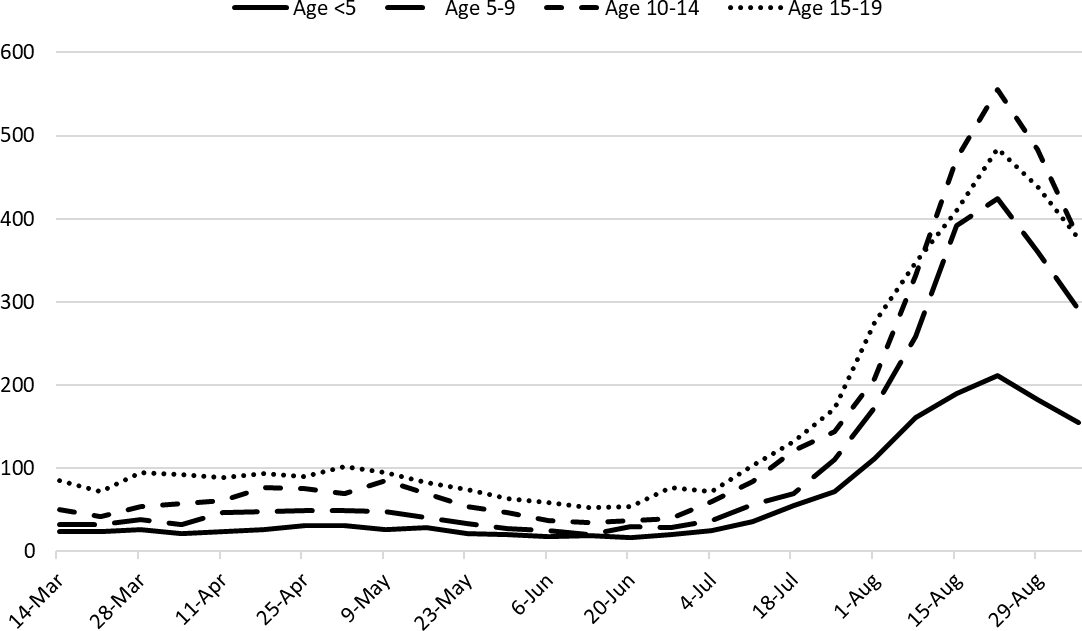
Figure 2a shows a sharp decline in transmission among children (dotted) over the past 2 weeks with the smallest gains being observed among the elderly (solid). While difficult to draw causal conclusions, recent mask mandates in certain districts, aggressive case identification, and limited classroom closures are likely helping as the steepest declines were among school-age children 5 – 19 years (Figure 2b). However, the reversal among adolescents may be somewhat attenuated once the impacts of university re-openings are fully realized (https://www.nature.com/articles/s41467-021-25169-3).
|
Figure 2a. COVID-19 Cases in Arizona by Age Group March 7 – September 5, 2021. |
|
Figure 2b. COVID-19 Cases in Arizona among Children by Age Group March 7 – September 5, 2021. |
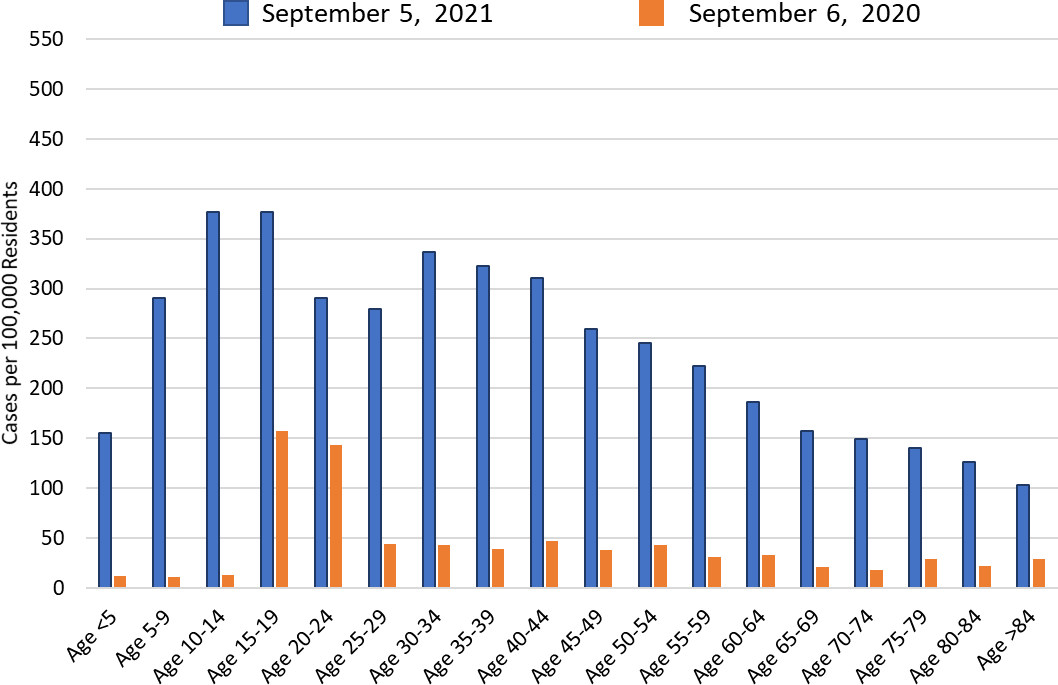
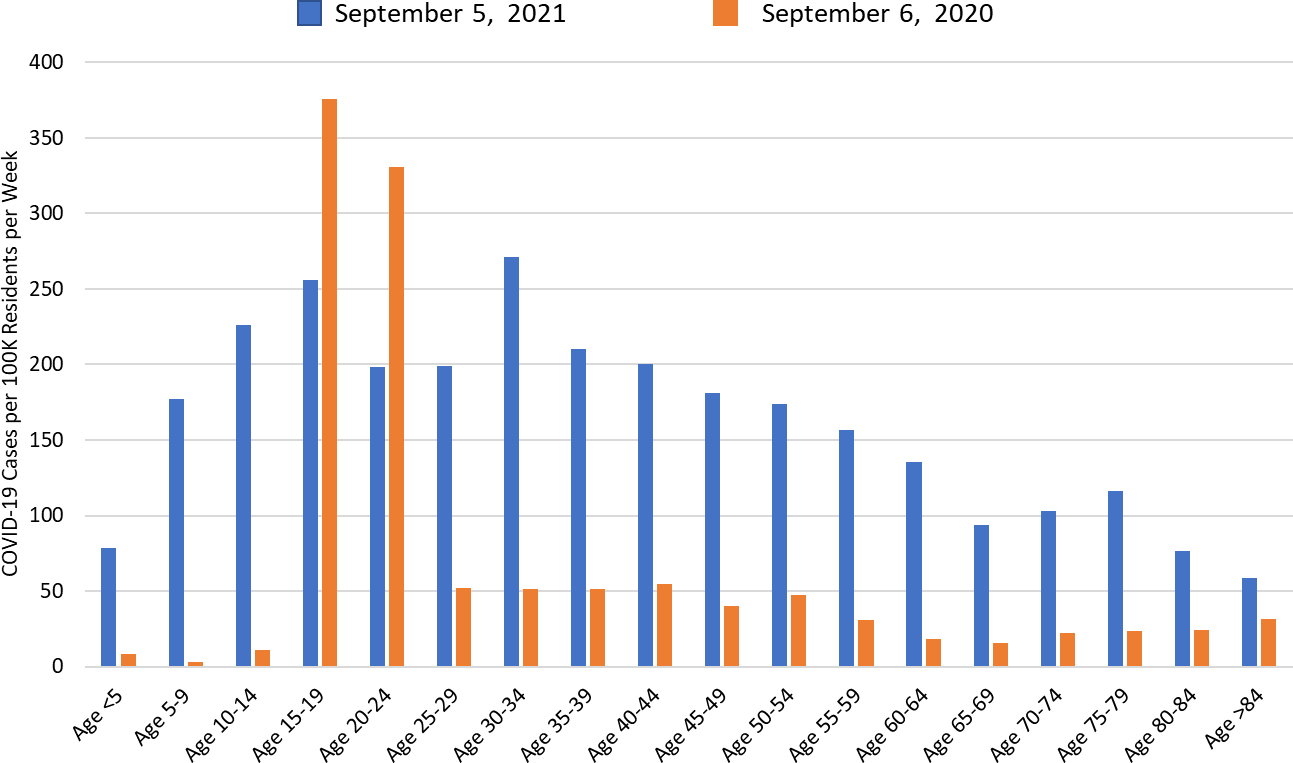
Comparing school reopening this year (in-person) with last year (virtual), levels of community transmission are much higher this year than last, particularly among those <15 years (Figure 2c). Higher transmission among those 15 – 24 years associated with university re-openings was first observed about this time last year (orange bars, ages 15 – 24). It is hard to believe how good conditions were this time last year – without reinforcing how impactful good better public policy and high better levels of individual cooperation can be.
|
Figure 2c. COVID-19 Cases in Arizona by Age Group Week Ending September 6, 2020 versus September 5, 2021. |
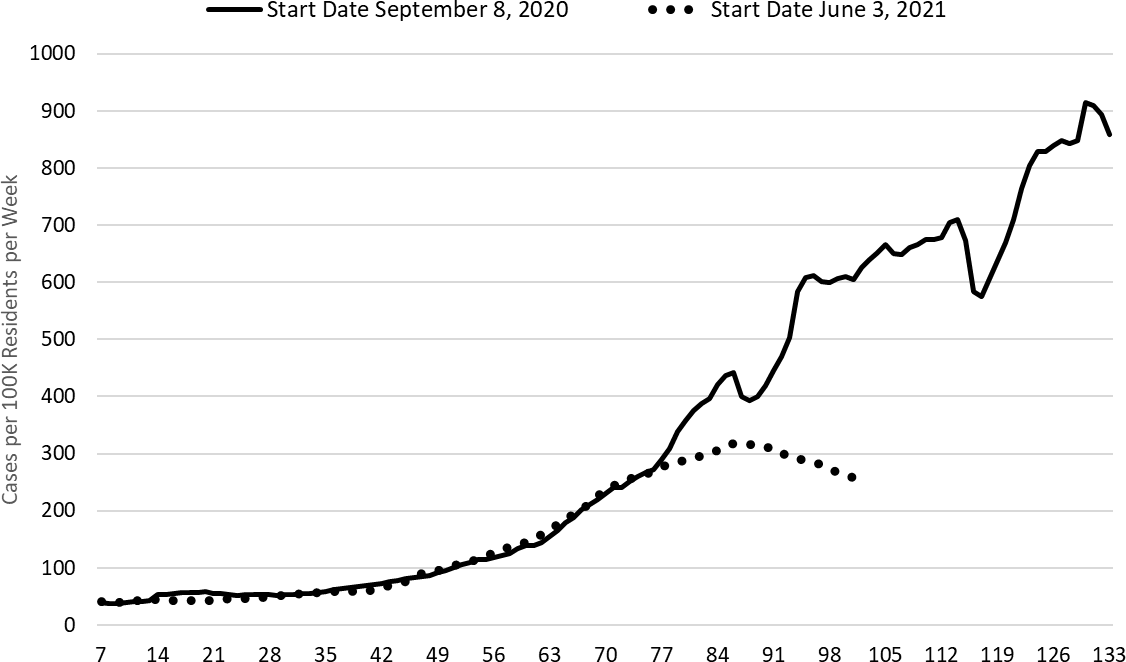
Over the past 3 weeks, the trajectory of the current outbreak and that of the winter 2020/2021 outbreak have meaningfully diverged (Figure 2d). While there have been temporary reversals before, it appears we are now experiencing a more permanent shift away from last year’s trajectory.
|
Figure 2d. Fall 2020 and Fall 2021 COVID-19 Waves Superimposed (102 days). |
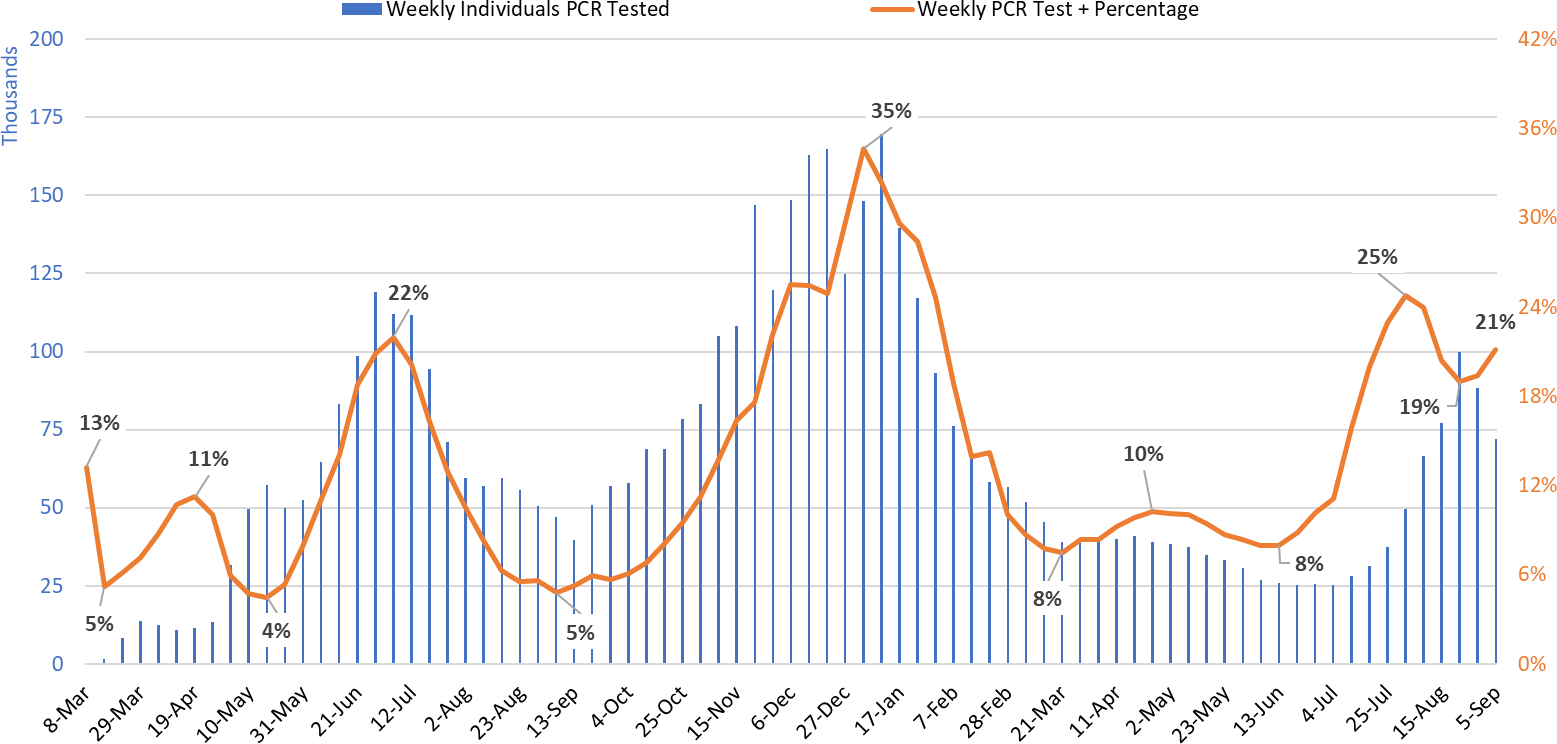
Test positivity among those undergoing traditional nasopharyngeal testing unexpectedly increased this week from to 19% to 21% (Figure 3). This level of positivity indicates that testing is inadequate for optimal public health practice and that many cases are going undiagnosed. Prior troughs in test positivity have preceded increasing transmission rates, so it is possible improvements could slow next week perhaps due to the impact of Labor Day. Alternatively, fewer people (i.e., the most symptomatic) may have been willing to test over the holiday.
|
Figure 3. Weekly Number of Patients Undergoing Traditional Nasopharyngeal PCR Testing and Associated Percent Positivity March 1, 2020 – September 5, 2021. |
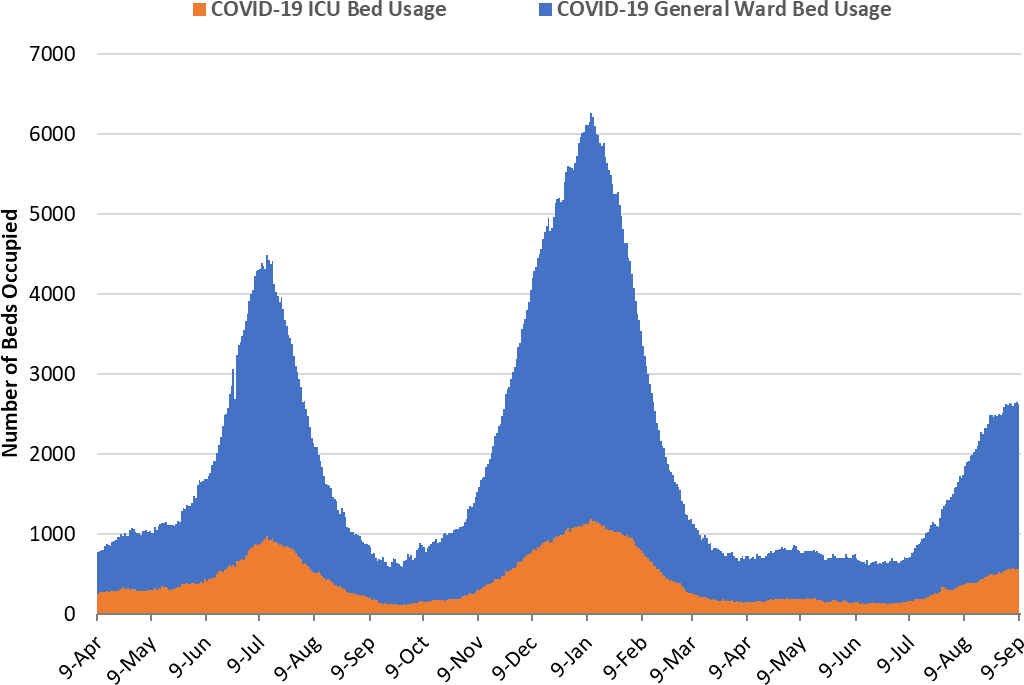
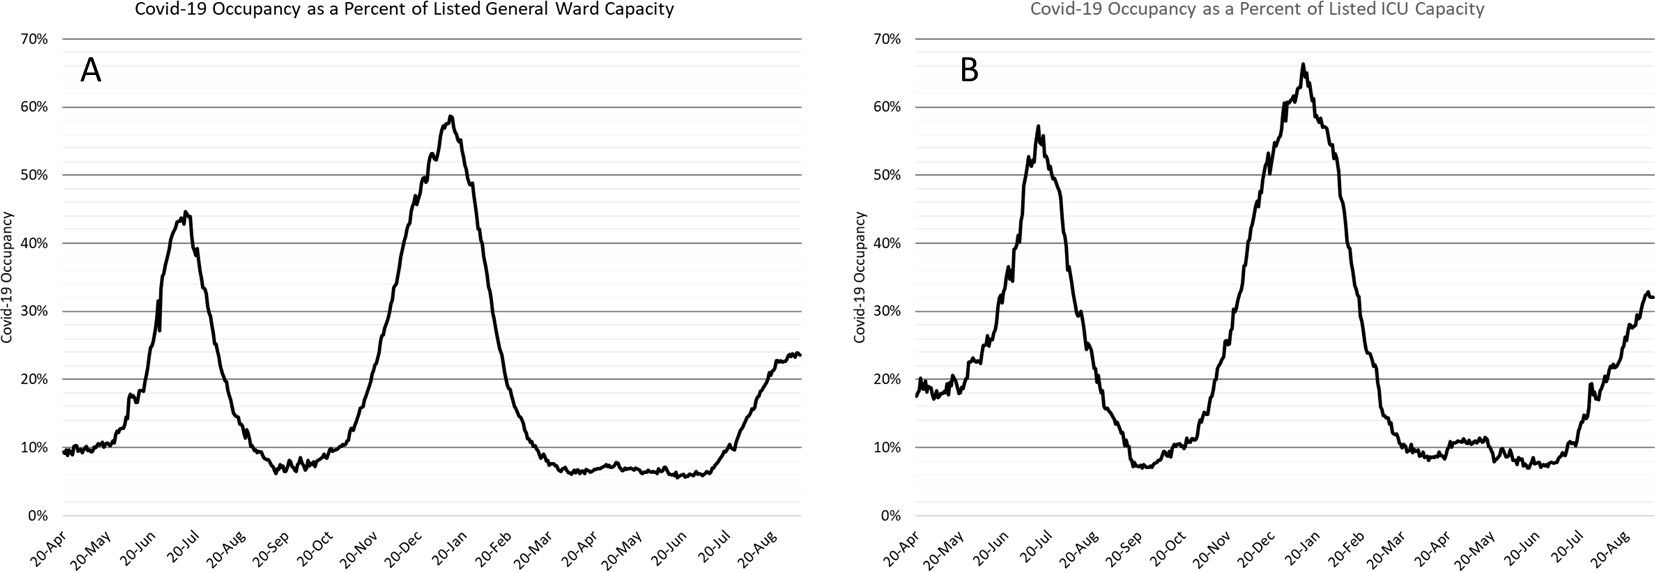
As of September 8th, 2061 (24%) of Arizona’s 8743 general ward beds were occupied by COVID-19 patients, a 0% decrease from last week’s 2070 occupied beds (Figure 4 and Figure 5 Panel A). Another 689 (8%) beds remained available for use. The number of available beds is somewhat lower than last week’s 737 beds.
|
Figure 4. Arizona Daily COVID-19 General Ward and ICU Census April 9, 2020 – September 8, 2021. |
As of September 8th, 561 (32%) of Arizona’s 1749 ICU beds were occupied by COVID-19 patients, a 2% increase from last week’s 549 occupied beds (Figure 4 and Figure 5 Panel B). An additional 143 (8%) ICU beds remained available for use, about the same as last week’s 139 beds.
As a lagging indicator, hospital occupancy appears to be plateauing as expected following declining case rates.
|
Figure 5. COVID-19 Occupancy as a Percent of Listed General Ward (A, left) and ICU (B, right) Capacity in Arizona April 20, 2020 – September 8, 2021. |
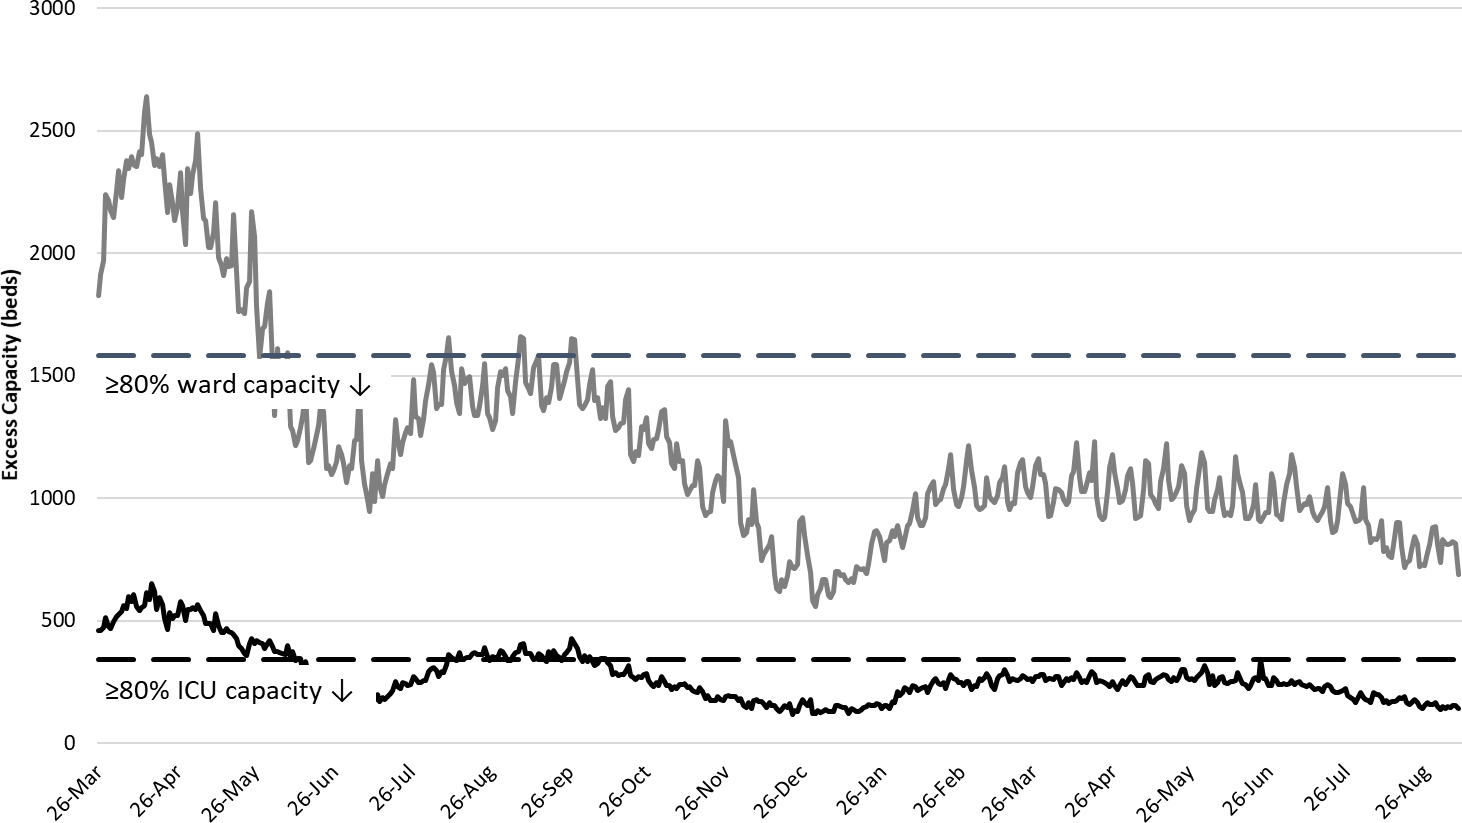
Arizona hospital occupancy remains above seasonal levels with safety margins, as measured by excess available beds, remaining quite low (Figure 6). Available capacity is essentially as low as it was at the height of the winter 2020/2021 surge. Although increases in occupancy are moderating soon in response to declining community transmission, hospitals should be prepared for >20% ward occupancy and >25% ICU occupancy for several more weeks. Even if you are vaccinated, the tail of the COVID-19 surge will still impact your access to healthcare services should you become ill for quite some time.
|
Figure 6. Observed Excess Non-Surge General Ward and ICU Capacity in Arizona March 26, 2020 – September 8, 2021. |
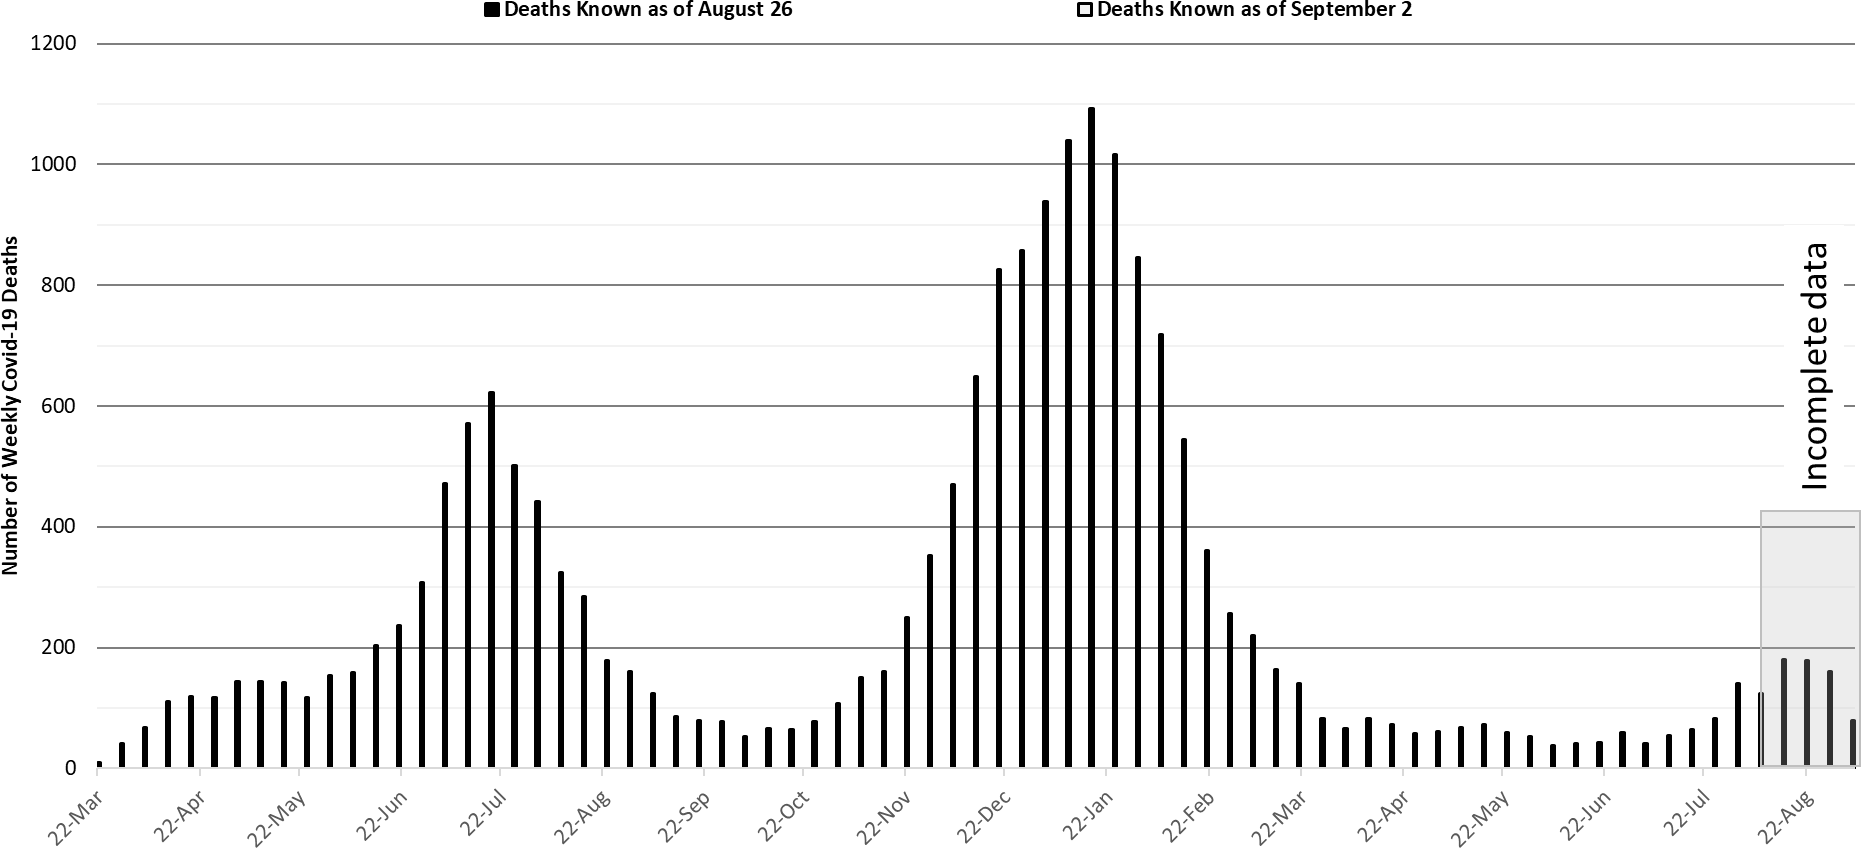
Arizona continues to experience >100 COVID-19 deaths per week (Figure 7). The week ending August 15th has recorded 180 deaths so far with the week ending August 22nd close behind with 178 deaths. Even so, the rise in the number of deaths is more muted than expected given the rise in cases. It now appears unlikely that Arizona will reach 300 deaths per week. Instead, the peak should occur at 200 deaths per week. This indicates that the case fatality rate has declined from its historical average of 1.5% to a new base rate nearing 1.0%. This is likely attributable to lower severity among younger cases and breakthrough cases.
|
Figure 7. Weekly Arizona COVID-19 Deaths March 16, 2020 – September 5, 2021. |
Pima County Outlook
For the week ending September 5th, 1792 Pima County residents were diagnosed with COVID-19 (Figure 8). This marks the 2nd week of declining case counts although the decline is more modest than the state trend.
|
Figure 8. Weekly COVID-19 Cases in Pima County and Number of Individuals Undergoing COVID-19 Diagnostic Testing March 1, 2020 – September 5, 2021. |
New cases are being diagnosed at a rate of 174 cases per 100K residents per week and is essentially holding steady. Trends across the various age groups appear in Figure 9.
|
Figure 9. COVID-19 Cases in Pima County by Age Group March 7, 2020 – September 5, 2021. |
The Pima County comparison of fall 2020 with fall 2021 show a more dramatic signal of the impact of university reopening on community transmission. Case rates among those 15 – 24 years of age were actually higher this time last year. It is important to acknowledge though that there is considerably less testing on university campuses this year than last. Nevertheless, being on the inside where the sausage is being made, I don’t sense there is as much transmission on campus this year as last. Many of our students have either been vaccinated or previously recovered providing at least some buffer against transmission.
|
Figure 10. COVID-19 Cases in Pima County by Age Group September 6, 2020 versus September 5, 2021. |
Summary
- Arizona continues to experience high levels of community transmission but, in a recent reversal, case rates are now modestly declining. Nevertheless, K – 12 in-person instruction and re-opening of our major universities will continue to put upward pressure on community transmission among children, adolescents, and young adults. Attenuation of improvements are possible in the wake of Labor Day.
- As of September 5, new cases were being diagnosed at a rate of 259 cases per 100K residents per week. The rate was decreasing by 32 cases per 100K residents per week. Rates are now 19% lower than their August 20th peak of 318 cases per 100K residents.
- The age distribution of transmission continues to be profoundly shifted towards infections among children <19 years of age. In-person instruction in K -12 schools and universities is continuing to generate school-associated outbreaks and contribute to community transmission. A layered approach with multiple non-pharmacologic interventions is necessary to return students safely to the classroom (https://science.sciencemag.org/content/372/6546/1092).
- Vaccination remains the most important public health priority to reduce viral spread and severe illness in the long run; however, mask mandates, restrictions on indoor gatherings, and targeted business mitigations are still needed to speed reductions in transmission and prevent a resurgence in the short-term. (https://science.sciencemag.org/content/372/6549/1439)
- While COVID-19 hospital occupancy is holding steady, it is likely to exceed 20% of all beds in the general ward and 25% of beds in the ICU for weeks to come. Access to care will remain restricted even on the backside of waning COVID-19 case rates. Expect delays in elective procedures to persist.
- Arizona is experiencing >100 COVID-19 deaths per week. Although weekly totals approaching 300 deaths are now improbable, totals reaching 200 for the end of August – early September are likely once all deaths are tabulated.
- According to the CDC, 60% of Arizona adults have received at least 2 doses of vaccine while another 10% have received 1-dose. In the face of the Delta variant, this is insufficient to prevent continued community transmission.
- Despite evidence of limited immune escape, especially before completion of the full vaccination sequence, vaccination continues to provide high levels of protection from severe illness (https://www.nejm.org/doi/full/10.1056/NEJMoa2110362)and they’re safe too (https://jamanetwork.com/journals/jama/fullarticle/2784015).
- In another major development, President Biden announced plans to require many federal workers to get vaccinated and require large private employers to vaccinate their workers, require weekly COVID-19 testing, or face monetary penalties.
- Dr. Deepta Bhattacharya discussed what we know so far about COVID-19 vaccines, the interactions between the vaccines and the latest variants, and the best strategies for staying healthy (https://provost.arizona.edu/content/campus-webinars).
- The CDC mask guidance for vaccinated individuals (https://www.cdc.gov/coronavirus/2019-ncov/vaccines/fully-vaccinated-guidance.html) and for K-12 instruction (https://www.cdc.gov/coronavirus/2019-ncov/community/schools-childcare/k-12-guidance.html) continue to recommend masking when indoors in public spaces where community transmission is high or substantial. If in close contact with a known case, vaccinated individuals should be tested in 3 – 5 days regardless of symptoms and wear a mask for 14 days post-exposure or until a negative test result.
Forecast reports to date, available as PDFs
Download PDF to view additional charts of Arizona counties, available in appendix of report.
September 10
2020 Reports
Based on what we know now about this pandemic, we support guidelines for social distancing to slow the spread of the virus and urge everyone to follow the recommendations provided by the Centers for Disease Control and Prevention (CDC) to protect yourself, your family, your neighbors, and your employees. Please heed the recommendations as provided by the CDC.
COVID covid coronavirus virus covid19 corona forecast model

