


Researcher Analyzes Arizona COVID-19 Spread Models for Decision-Makers
The following information regarding the spread of COVID-19 in Arizona was prepared by Joe Gerald, MD, PhD, a researcher at the Mel and Enid Zuckerman College of Public Health (MEZCOPH) at the University of Arizona. This information has also been reviewed by other MEZCOPH faculty.
This data were obtained from the Arizona Department of Health Services COVID-19 webpage and reflect conditions in Arizona as of March 4, 2022.
This information is intended to help guide our response to the outbreak. It is not intended to predict how this pandemic will evolve. Rather, this model extrapolates what might occur if current conditions remain unchanged. As regional authorities and healthcare providers respond, their actions are expected to mitigate the worst consequences of this pandemic.

COVID-19 Disease Outbreak Forecast
Arizona State and Pima County
Updated March 4, 2022
Disclaimer: This information represents my personal views and not those of The University of Arizona, the Zuckerman College of Public Health, or any other government entity. Any opinions, forecasts, or recommendations should be considered in conjunction with other corroborating and conflicting data. Updates can be accessed at https://publichealth.arizona.edu/news/2021/covid-19-forecast-model.
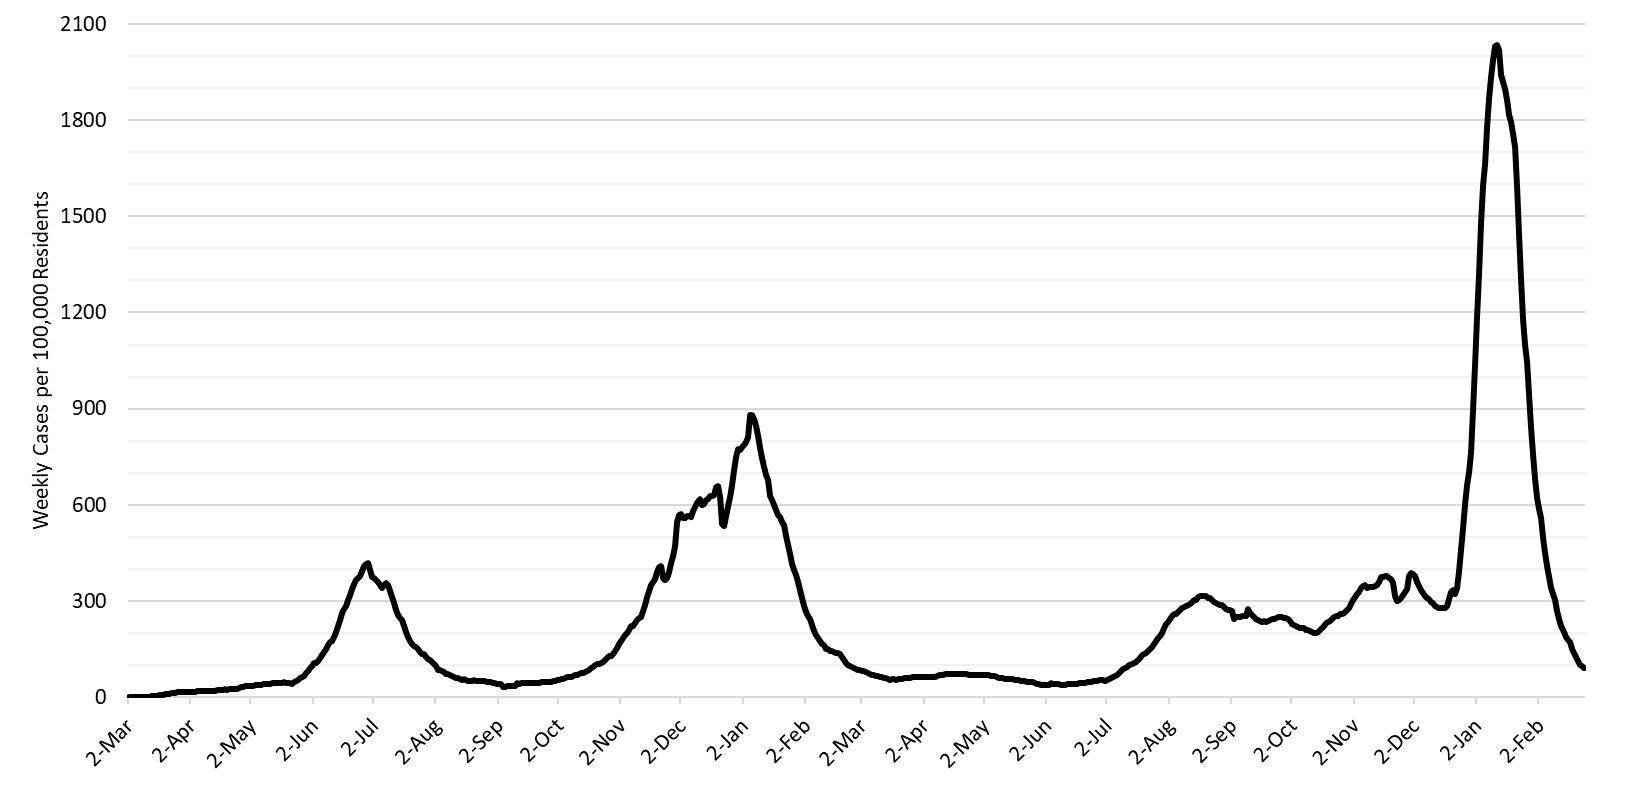
Figure 1. COVID-19 Cases per 100,000 Residents per Week in Arizona March 1, 2020 – February 27, 2022.
For the week ending February 27th, 6590 Arizonans were diagnosed with COVID-19, a 47% decrease from the 12378 cases reported last week. New cases are being diagnosed at a rate of at 91 cases per 100K residents per week (Figure 1). The transmission rate has fallen below the high threshold for the first time since July 2021. The state will likely fall below the threshold separating substantial and moderate transmission next week, <50 cases per 100K residents per week. Rates are highest among those >65 years of age and lowest among those <15 years of age, 119 versus 60 cases per 100K residents, respectively (Figure 2a following page).
Arizona’s new case ranking fell to 19th place this week with the nation’s leaders being Idaho (576), Montana (358), Alaska (307), West Virginia (270), and Washington (232). The CDC’s updated community levels rating places all Arizona counties except Yuma and La Paz at medium risk. When at medium risk, the CDC does not deem community masking to be necessary, YMMV.
Infection risk is highest in crowded, poorly ventilated indoor spaces where unmasked people spend prolonged periods of time. Risk can be lowered by ensuring high levels of vaccination among attendees, requiring rapid COVID-19 testing before entry, and requiring KN-94 or better masking. When ≥2 of these practices are required and community transmission levels are low, the infection risk is also low but not quite zero.
According to the CDC, 43% of Arizona adults and 59% of its seniors have obtained a third dose booster. The CDC recommends everyone ≥12 years who received Pfizer primary sequence should receive a booster; ≥18 years if they received the Moderna primary sequence. However, the ADHS Vaccine Dashboard shows weekly vaccine doses delivered fell to 40K doses last week indicating progress has mostly stalled. Low booster rates, low prior infection rates, and waning immunity among the elderly poses a risk of continued hospitalizations and deaths despite improving overall conditions.
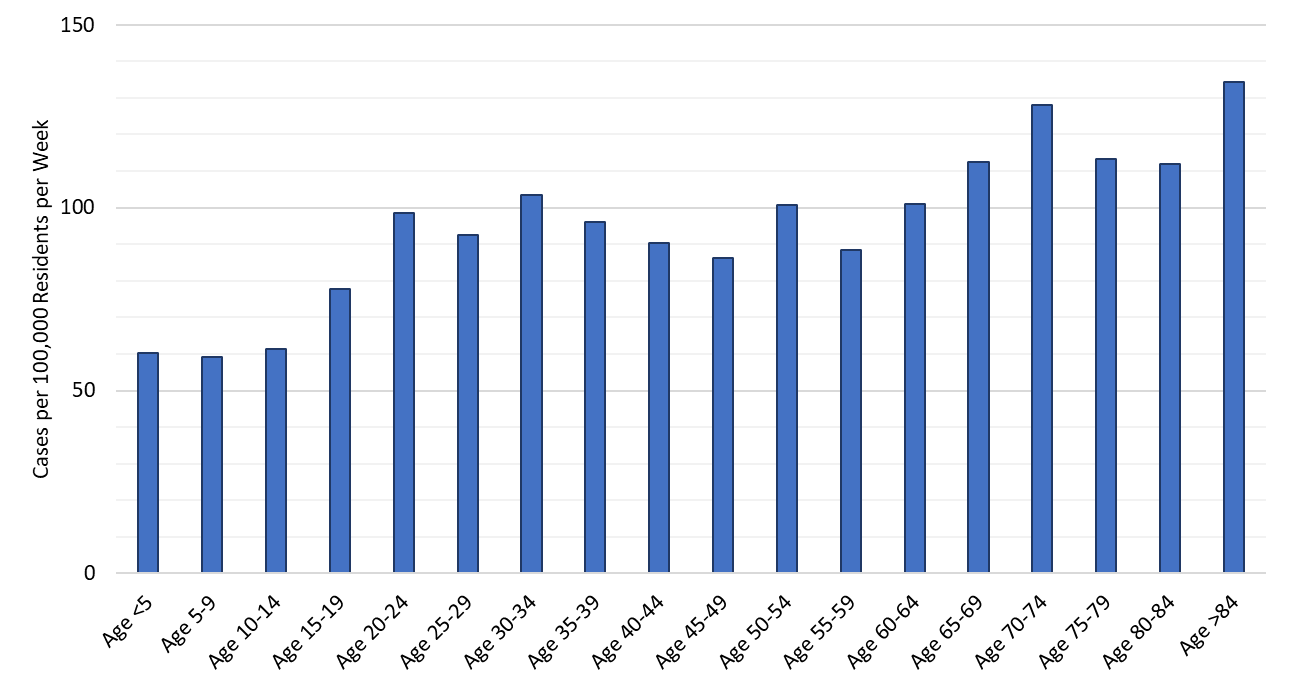
Figure 2a. COVID-19 Weekly Incidence in Arizona by Age Group February 20 – 27, 2022
Figure 2a shows a two-fold difference in current transmission rates between those <15 years and >65 years.
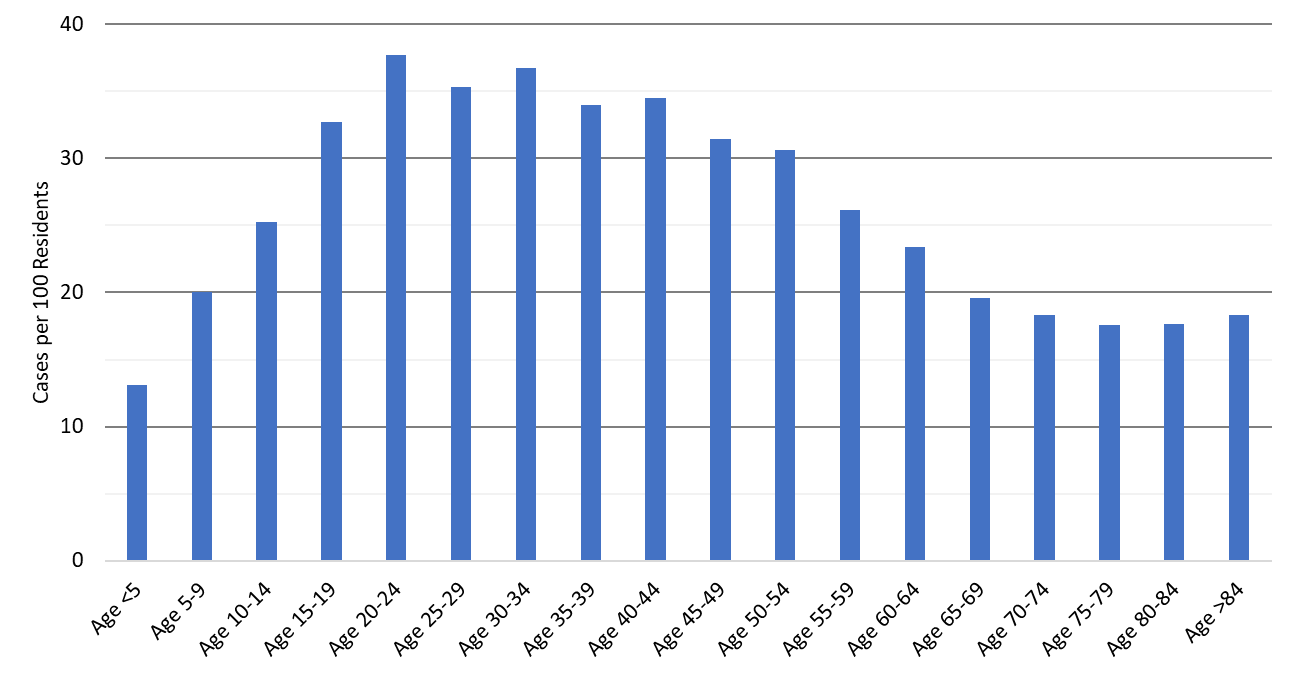
Figure 2b. Cumulative Covid-19 Cases per 100 Arizona Residents by Age Group through February 27, 2022.
Historically, infection rates have been highest among those 15 – 54 years of age and lowest among the young and elderly (Figure 2b). Given the approximate ratio of 2 undiagnosed cases for every known case, most working-age Arizonans have likely been infected with the SARS-CoV-2 virus at some point during the pandemic.
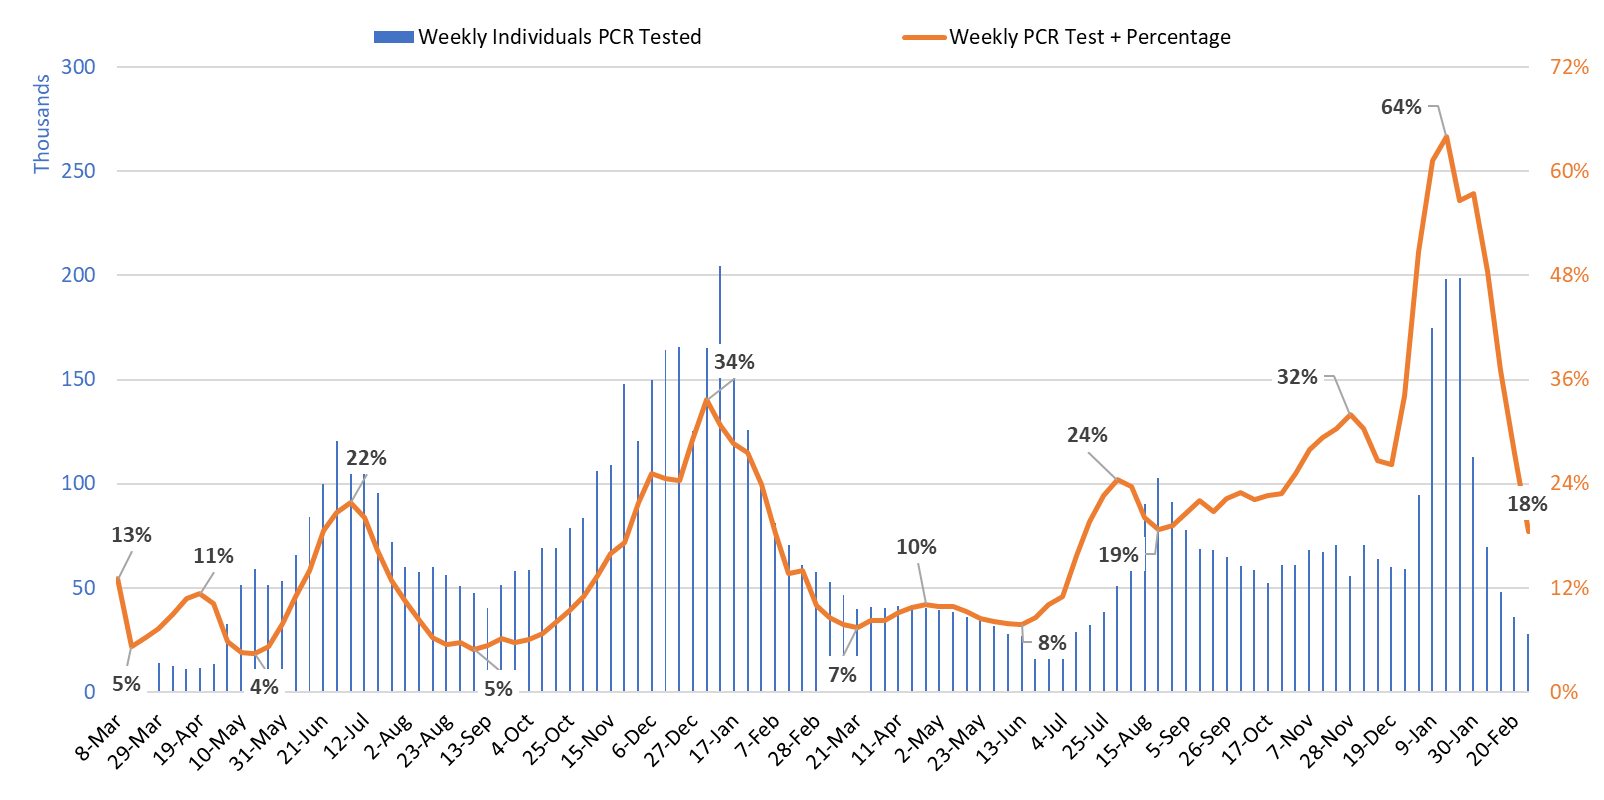
Figure 3. Weekly Number of Patients Undergoing Traditional Nasopharyngeal PCR Testing and Associated Percent Positivity March 1, 2020 – February 27, 2022.
Test positivity continues to fall but remains high at 18% (Figure 3). The traditional PCR testing base has fallen rapidly with only about 30K Arizonans being tested last week. While estimates are scarce, some number of individuals have likely transitioned to at-home testing.
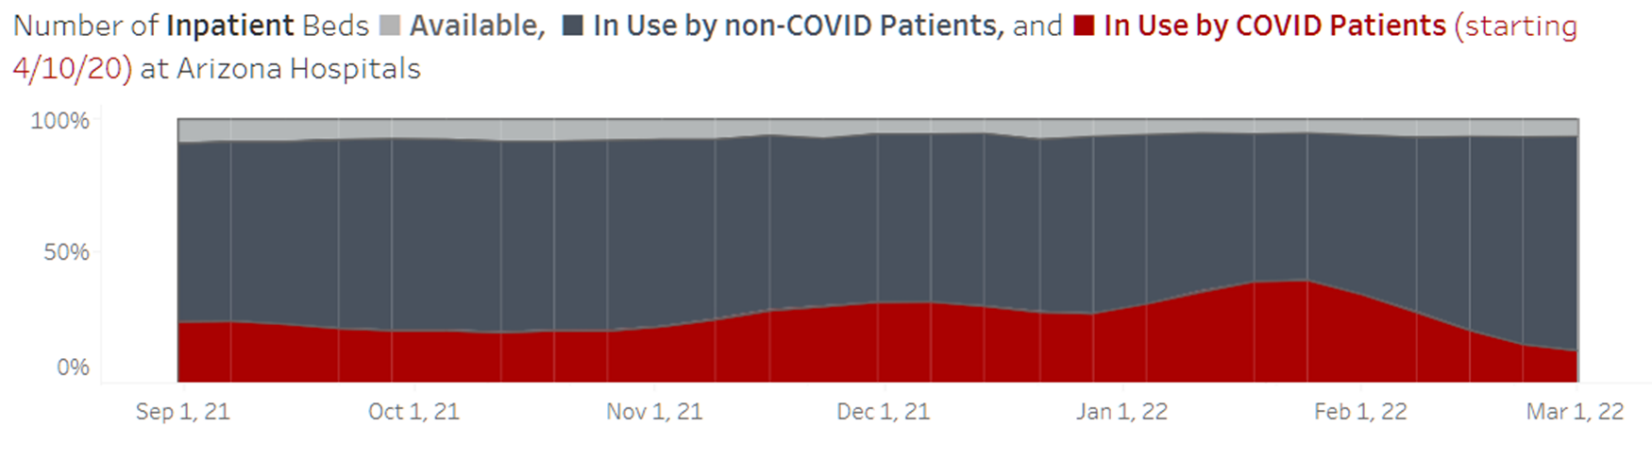
Figure 4. Arizona Average Weekly Hospital Ward Census September 1, 2021 – March 1, 2022 (COVID-19 in red, non-COVID in dark gray, and available beds in light gray).
For the week ending February 28th, 1124 (15%) of Arizona’s 7521 general ward beds were occupied by COVID-19 patients, a 38% decrease from the week prior, 1777 occupied beds (Figure 4). Another 507 (7%) beds remained available for use which is lower than the prior week’s 582 available beds. Improvement in count occupancy is overstated due to hospital non-reporting after the ADHS change to weekly updates. Specifically, 8756 total ward beds were noted on February 24th, but only an average of 7521 total beds were noted for the week ending February 28th. Some 1200 ward beds went missing. Because this is difficult for Dashboard users to detect, cautious is advised. If non-reporting grows it could skew the new CDC Community Levels rating due to non-reporting bias. For now, it should at least be recognized that the count of COVID-19 occupied ward beds is no longer exactly comparable to historical estimates. The percent occupancy is less affected. This technical point does not materially change the fact that hospital COVID-19 occupancy continues to decline.
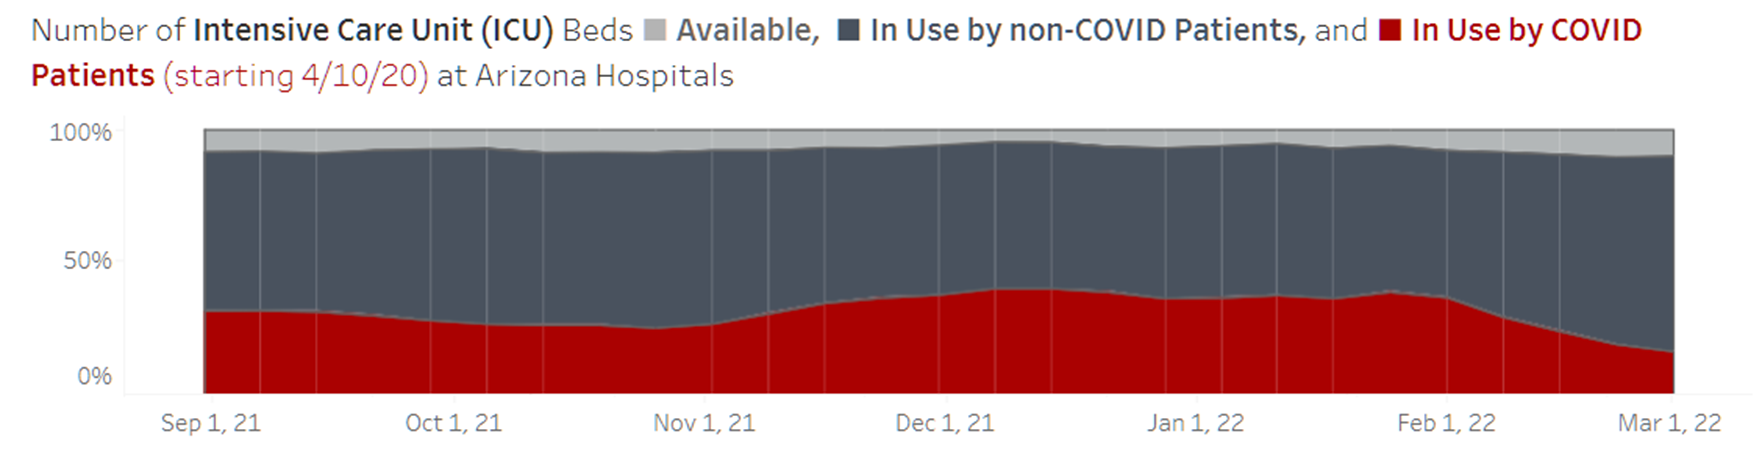
Figure 5. Arizona Average Weekly Hospital ICU Census September 1, 2021 – March 1, 2022 (COVID-19 in red, non-COVID in dark gray, and available beds in light gray).
For the week ending February 28th, an average of 270 (19%) of Arizona’s 1402 ICU beds were occupied by COVID-19 patients, a 32% decrease from last week’s 395 occupied beds (Figure 5). Another 144 (10%) beds remained available for use which is lower than last week’s 154 available beds. The 32% decrease in count occupancy overestimates actual improvement due to non-reporting. For example, 1644 total ICU beds were noted on February 24th, but only 1402 average beds were noted the week ending February 28th. Therefore, some 240 ICU beds went missing. The same caveats that apply to ward count occupancy applies to ICU occupancy.
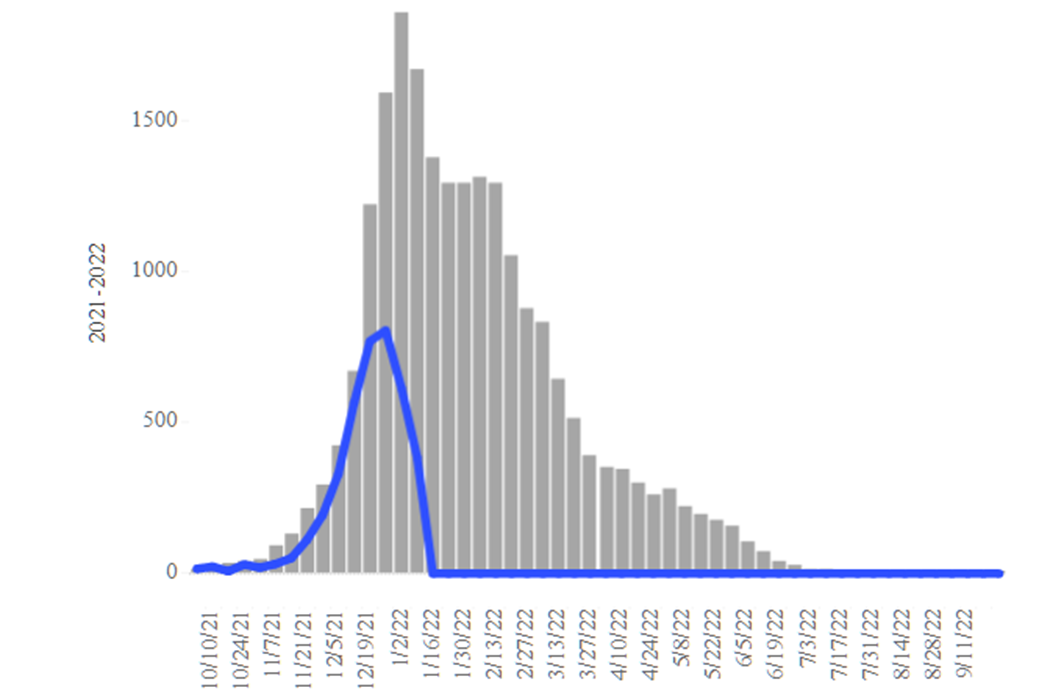
Figure 6. Arizona Influenza Cases in 2021 (blue) versus 5-Year Historical Average (grey)
Seasonal influenza cases in Arizona (blue line) is experiencing a second wind with cases rising markedly this past week. Even so, rates remain below the state’s 5-year historical average (grey bars, Figure 6). Hospitals should see fewer COVID-19 admissions but influenza cases may decline more slowly than expected over the coming weeks.
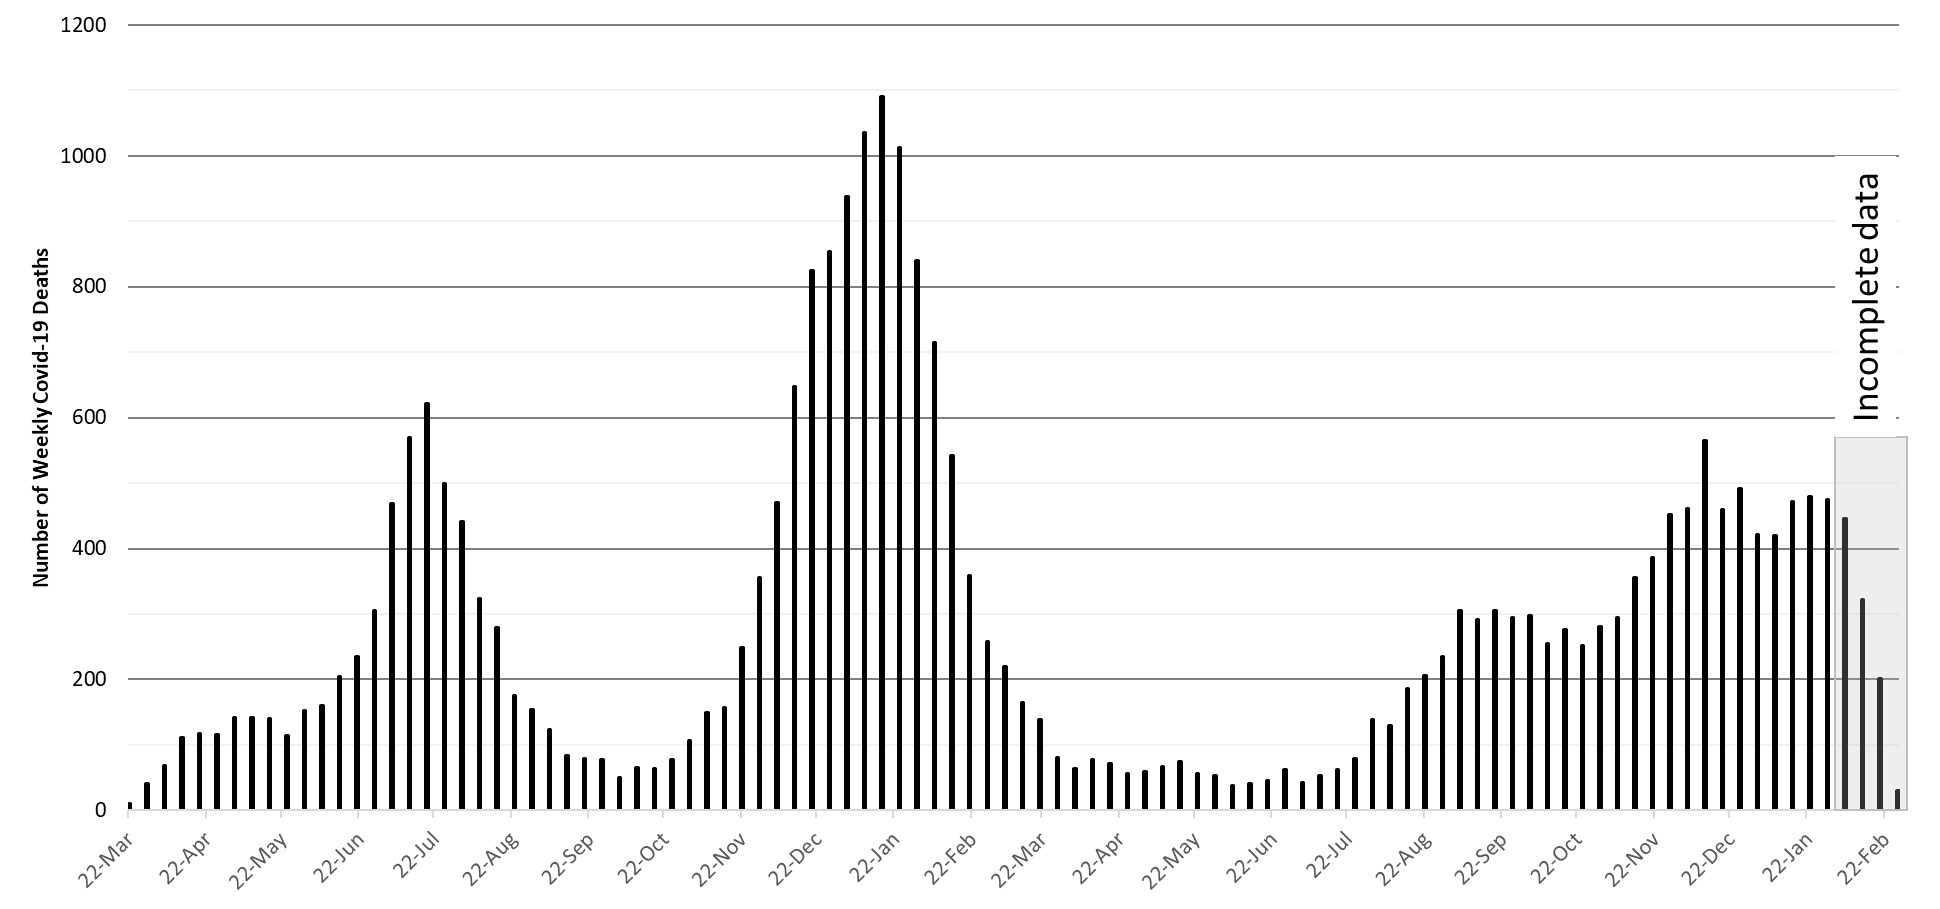
Figure 7a. Weekly Arizona COVID-19 Deaths March 16, 2020 – February 27, 2022.
The week ending December 12th has now recorded 565 deaths. This will be the only week during the Delta - Omicron waves that deaths will reach 500 weekly (Figure 7a). Even so, COVID-19 deaths remain quite high by historical standards.
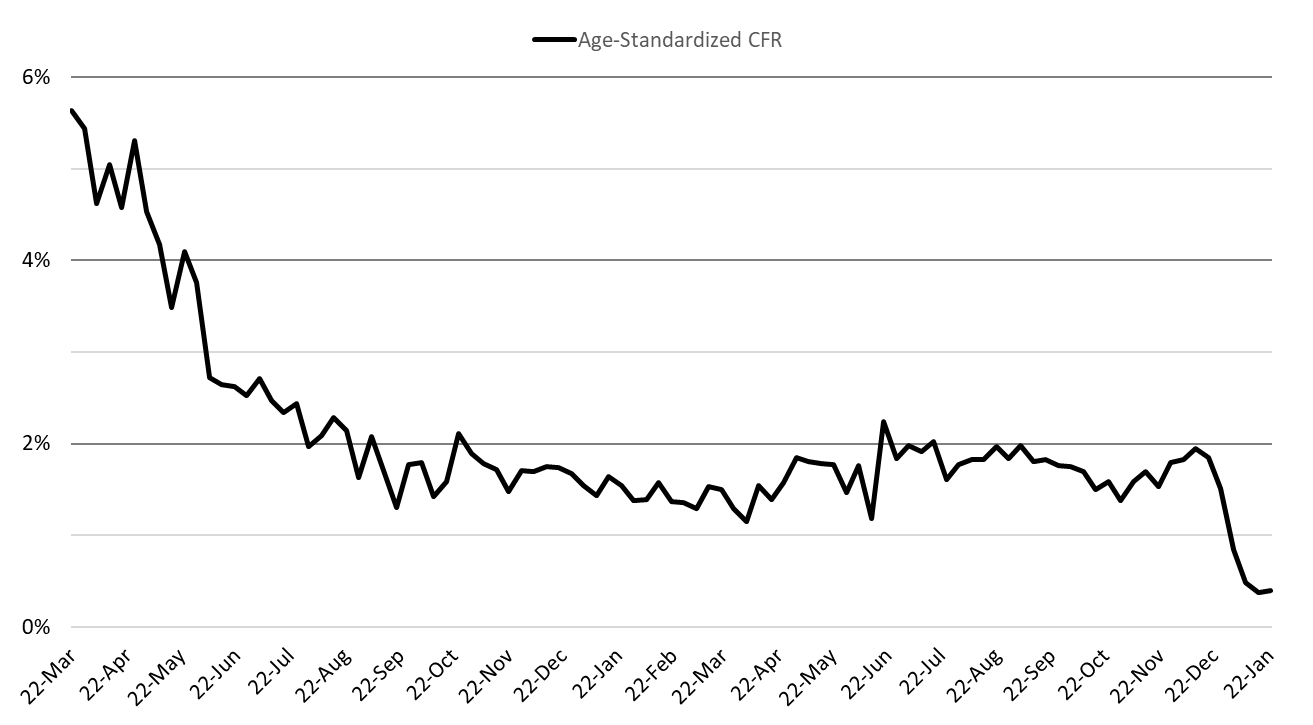
Figure 7b. COVID-19 Age-Standardized Case Fatality Rate March 22, 2020 – January 23, 2022 (October 25, 2020 case distribution).
For some reason, the ADHS Dashboard does not seem to be updating the cumulative tally of COVID-19 deaths. Last week, the Dashboard reported 27931 deaths; this week it reports 27708. When I tabulated data from my update this week, I have 28607 cumulative deaths. The age-standardized case fatality rate has leveled off at 0.4% from its prior rate of 1.5% and may tick up slightly before reaching a new steady state (Figure 7b).
Pima County Outlook
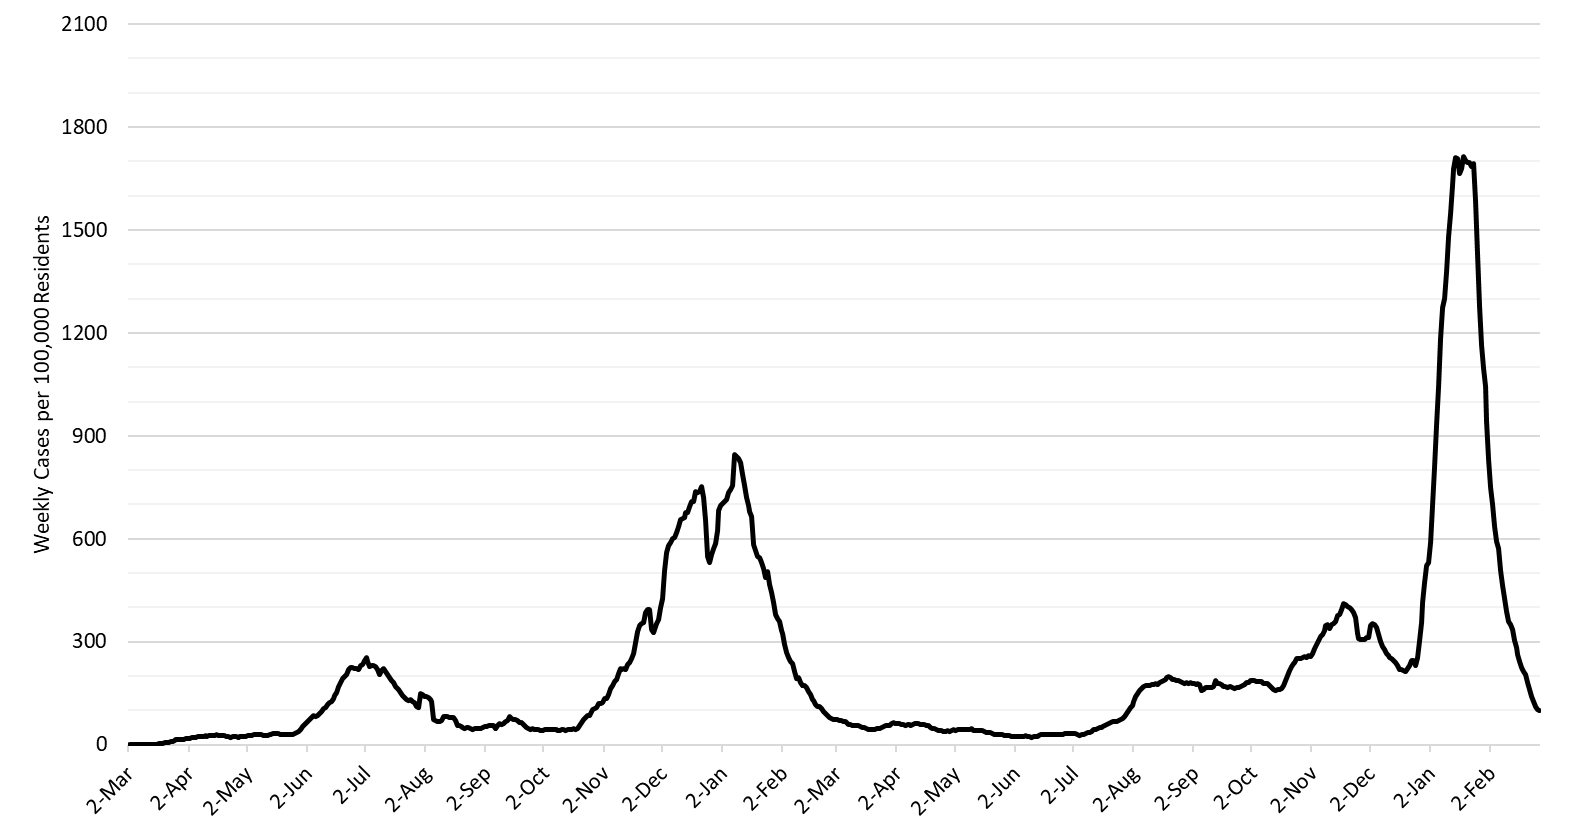
Figure 8. COVID-19 Cases per 100,000 Residents per Week in Pima County March 2, 2020 – February 27, 2022.
For the week ending February 27th, 1028 Pima County residents were diagnosed with COVID-19, a 54% decrease from the initial tally of 2218 cases last week. New cases are being diagnosed at 98 cases per 100K residents per week (Figure 8).
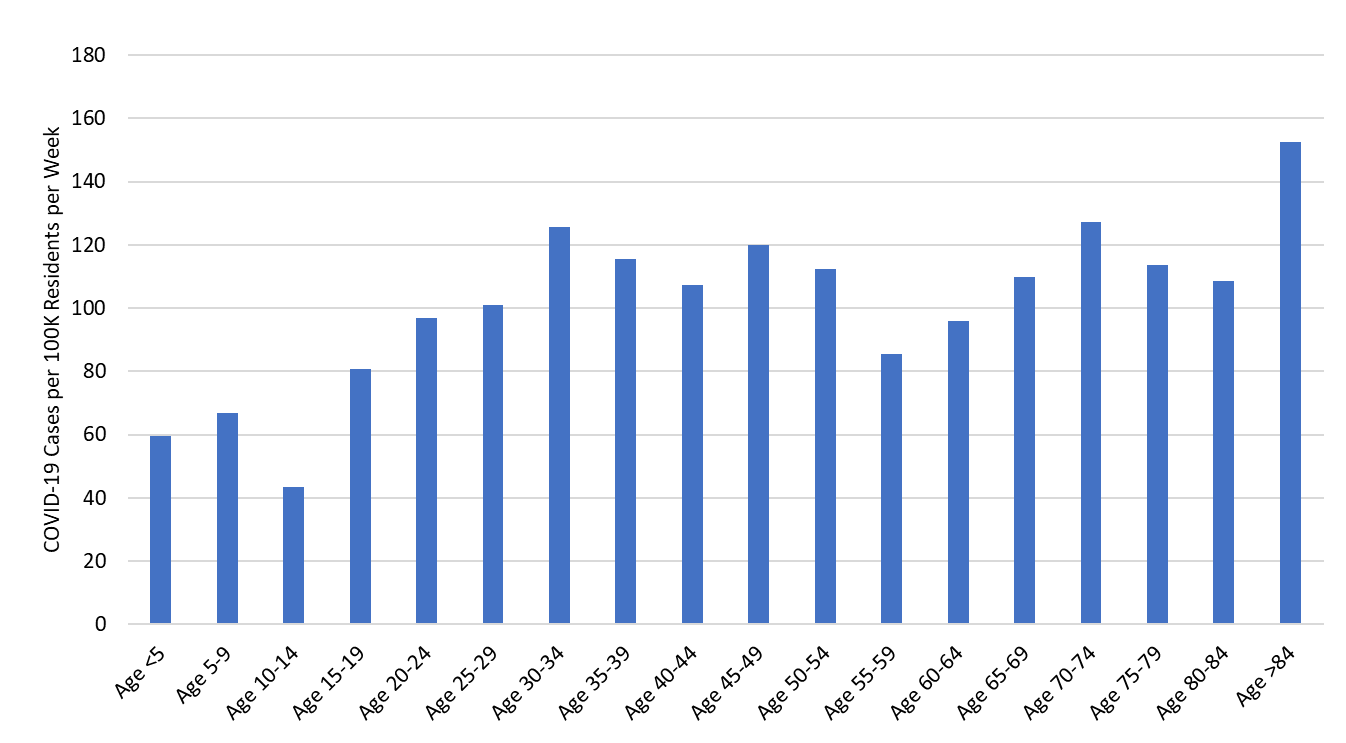
Figure 9. COVID-19 Weekly Incidence in Pima County by Age Group February 20 - 27, 2022.
Transmission by age group is shown in Figure 9.
Summary
- Arizona’s new case rate has finally fallen into the substantial transmission category, 50 - 100 cases per 100K residents per week. Rapid improvements may continue for an additional number of weeks that will quickly drive us into the moderate risk category, 10 - 50 cases per 100K residents per week.
- As of February 27th, new cases were being diagnosed at a rate of 91 cases per 100K residents per week. Case rates remain above the CDC threshold for high transmission in Navajo, Apache, Cochise, Greenlee, Graham, Coconino, La Paz, and Gila counties (Appendix Figure 1A). No county has achieved moderate transmission.
- During March more institutions and individuals will be relaxing their COVID-19 mitigation practices. For those who are healthy, vaccinated or recovered, normalization will pose little risk. Those who have personal health conditions, family members with personal health conditions, or those who interact with the vulnerable should continue to mitigate until transmission levels fall further.
- COVID-19 hospital occupancy in the wards and ICUs continues to fall along with case rates. Access to care will continue to be constrained by COVID-19 occupancy, influenza cases, and the backlog of postponed care. For those looking for a marker of normalcy, hospitals won’t be back to “normal” until available beds approach 30%, typical summer availability levels – it varies throughout the year.
- ADHS Dashboard users, bear in mind that the total number of ward beds (capacity) has historically been around 8750; the ICU capacity has been around 1640 beds. This will give you a rough guide to non-reporting or shifts in occupancy as you follow the data.
- At least 28607 Arizonans have lost their lives to COVID-19. Weekly totals in the low-400s are likely end soon as the Omicron surge resolves.
- Higher than expected hospitalization and mortality could linger owing to the combination of low third shot booster uptake among the elderly, low prior infection rates among this group, and generally waning immunity. It will not be enough to overcrowd hospitals but those who have not obtained a third shot booster should still consider doing so even though conditions are improving.
- Is BA.2 here in Arizona? According to the TGen Dashboard the BA.2 variant is unexpectedly receding. It is once again <5% of sequenced cases. So, I guess I’ll have to eat my prior words about it becoming the dominant variant over the coming month. Beats me? https://pathogen.tgen.org/covidseq-tracker/
- NOTE: This will be the last weekly update; no more are planned. If there is another major change/threat then the reports will likely resume. For now, I’m taking a breather to recharge and regroup.
Forecast reports to date, available as PDFs
Download PDF to view additional charts of Arizona counties, available in appendix of report.
March 4
2021 Reports
Based on what we know now about this pandemic, we support guidelines for social distancing to slow the spread of the virus and urge everyone to follow the recommendations provided by the Centers for Disease Control and Prevention (CDC) to protect yourself, your family, your neighbors, and your employees. Please heed the recommendations as provided by the CDC.
COVID covid coronavirus virus covid19 corona forecast model

