


Note this forecast page is not the most recent forecast available.
View the most current forecast report
Researcher Analyzes Arizona COVID-19 Spread Models for Decision-Makers
The following information regarding the spread of COVID-19 in Arizona was prepared by Joe Gerald, MD, PhD, a researcher at the Mel and Enid Zuckerman College of Public Health (MEZCOPH) at the University of Arizona. This information has also been reviewed by other MEZCOPH faculty.
This data were obtained from the Arizona Department of Health Services COVID-19 webpage and reflect conditions in Arizona as of Januray 7, 2022.
This information is intended to help guide our response to the outbreak. It is not intended to predict how this pandemic will evolve. Rather, this model extrapolates what might occur if current conditions remain unchanged. As regional authorities and healthcare providers respond, their actions are expected to mitigate the worst consequences of this pandemic.

COVID-19 Disease Outbreak Forecast
Arizona State and Pima County
Updated January 7, 2022
Disclaimer: This information represents my personal views and not those of The University of Arizona, the Zuckerman College of Public Health, or any other government entity. Any opinions, forecasts, or recommendations should be considered in conjunction with other corroborating and conflicting data. Updates can be accessed at https://publichealth.arizona.edu/news/2021/covid-19-forecast-model.
|
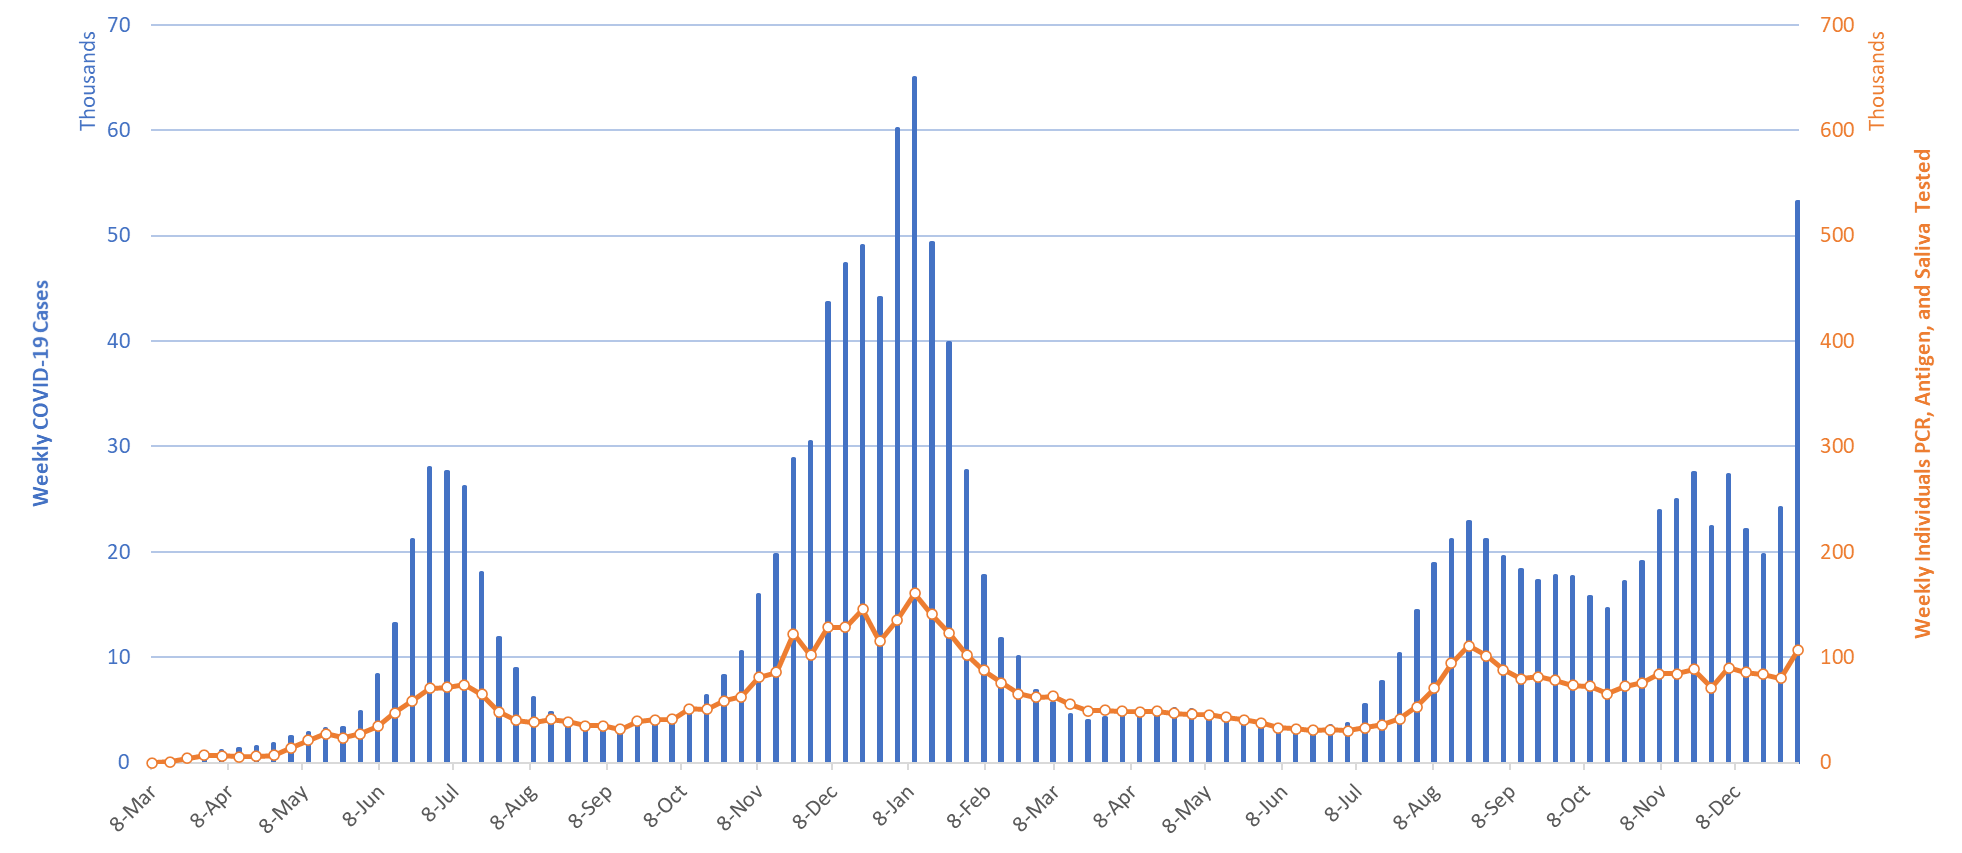
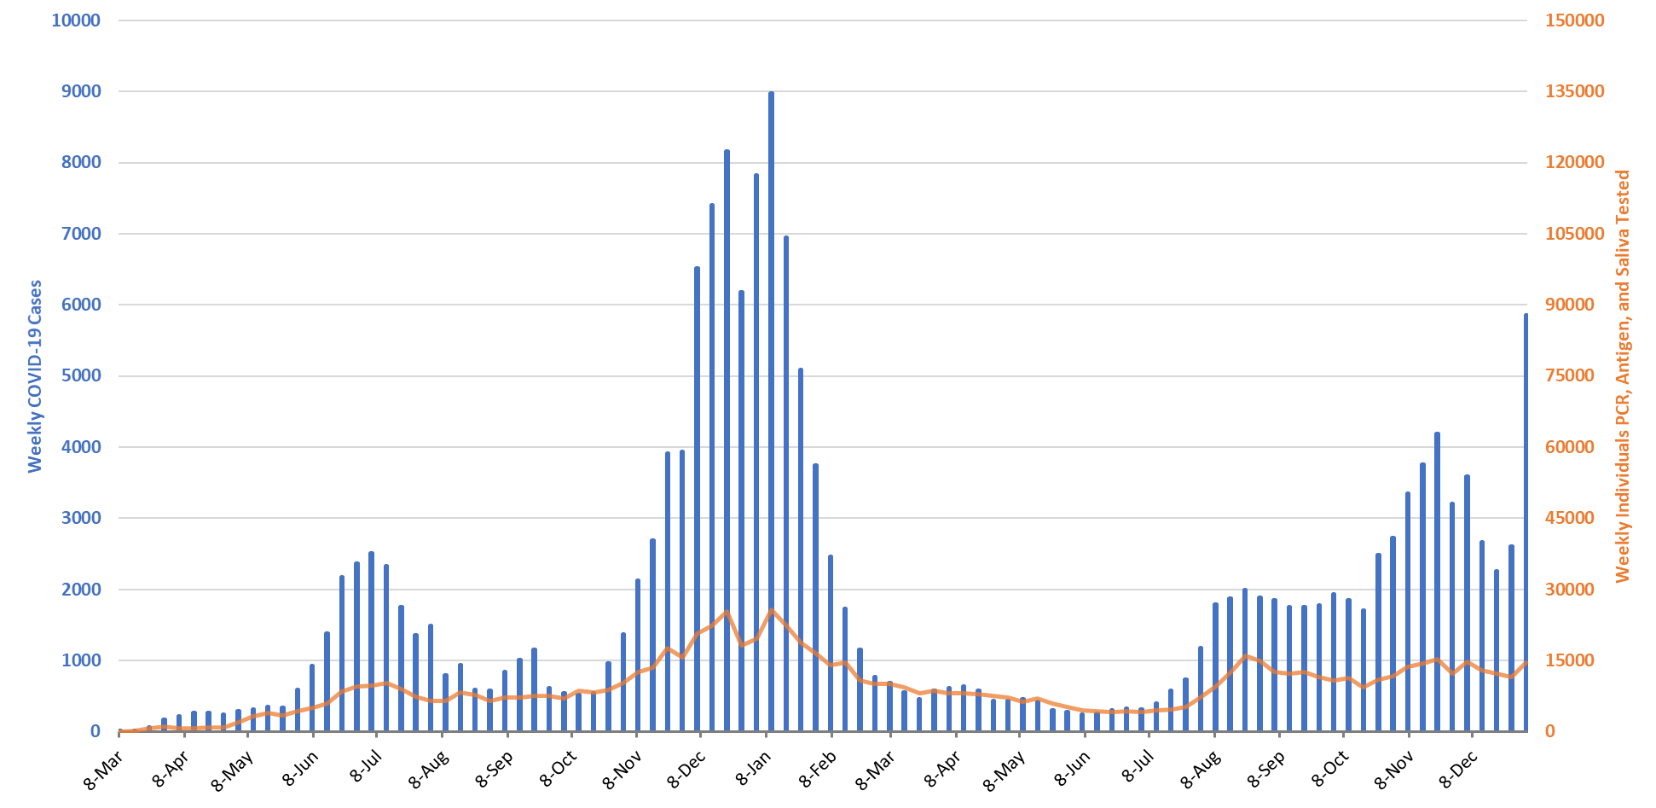
Figure 1. Weekly COVID-19 Cases in Arizona and Number of Individuals Undergoing COVID-19 Diagnostic Testing March 1, 2020 – January 2, 2022. |
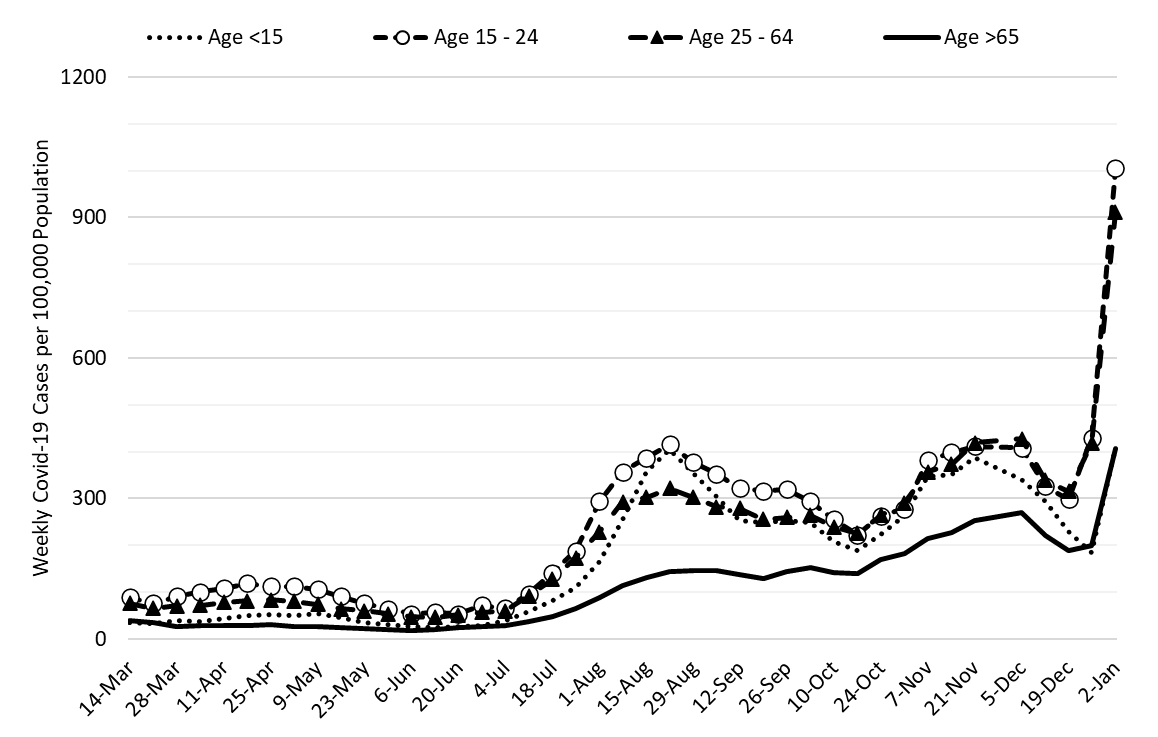
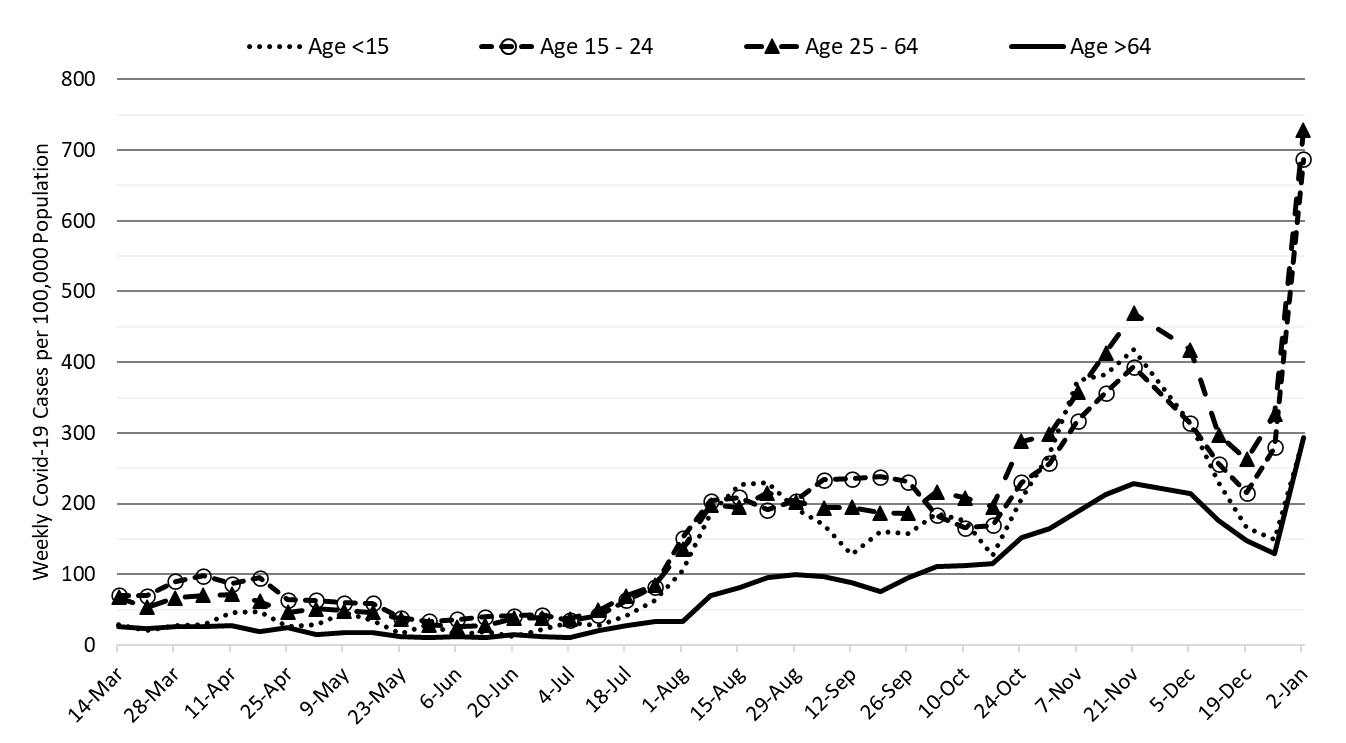
For the week ending January 2nd, 53207 Arizonans were diagnosed with COVID-19, a 120% increase from the 24196 cases reported during the prior week (Figure 1). The largest weekly pandemic total, 64981 cases, occurred the week ending January 10, 2021. We will almost certainly exceed this sum in next week’s report. Cases are currently being diagnosed at a rate of 731 cases per 100K residents per week. Rates are highest among those 15 – 24 years, 1005 cases per 100K residents. They are lowest among those ≥65 years and <15 years, 407 and 409 cases per 100K residents, respectively (Figure 2a below).
Arizona’s new case ranking has dropped to 40th signifying massive outbreaks in the eastern US. The nation’s leaders are New Jersey (2436), New York (2420), Rhode Island (2345), Delaware (1855), and Massachusetts (1850). According to the CDC, only 34% of Arizona adults and 53% of its seniors are vaccinated with a third dose booster. Fortunately, the primary 2-dose Pfizer sequence retains 70% protection against hospitalization from Omicron. Our immunity wall may hold although it is not certain. The ADHS Vaccine Dashboard shows weekly doses delivered have dropped to 125K doses. The CDC recommends everyone ≥12 years who received Pfizer primary sequence should receive a booster; ≥18 years if they received the Moderna primary sequence.
AD NAUSEUM→ Arizona continues to experience a high number of cases, hospitalizations, and deaths. With waning vaccine efficacy and a potentially short duration of acquired immunity, herd immunity is not achievable. As time progresses, more individuals will become susceptible. While the previously vaccinated and previously infected will remain mostly protected from severe outcomes, they will contribute to community transmission. Unvaccinated Arizonans will not be able to avoid infection by “free riding” on high levels of community immunity. The decision to remain unvaccinated carries a much greater risk than getting vaccinated. For the vaccinated, third-shot boosters provide additional protection and should be a priority for anyone >50 years to ward off infection from the newly dominant Omicron variant.
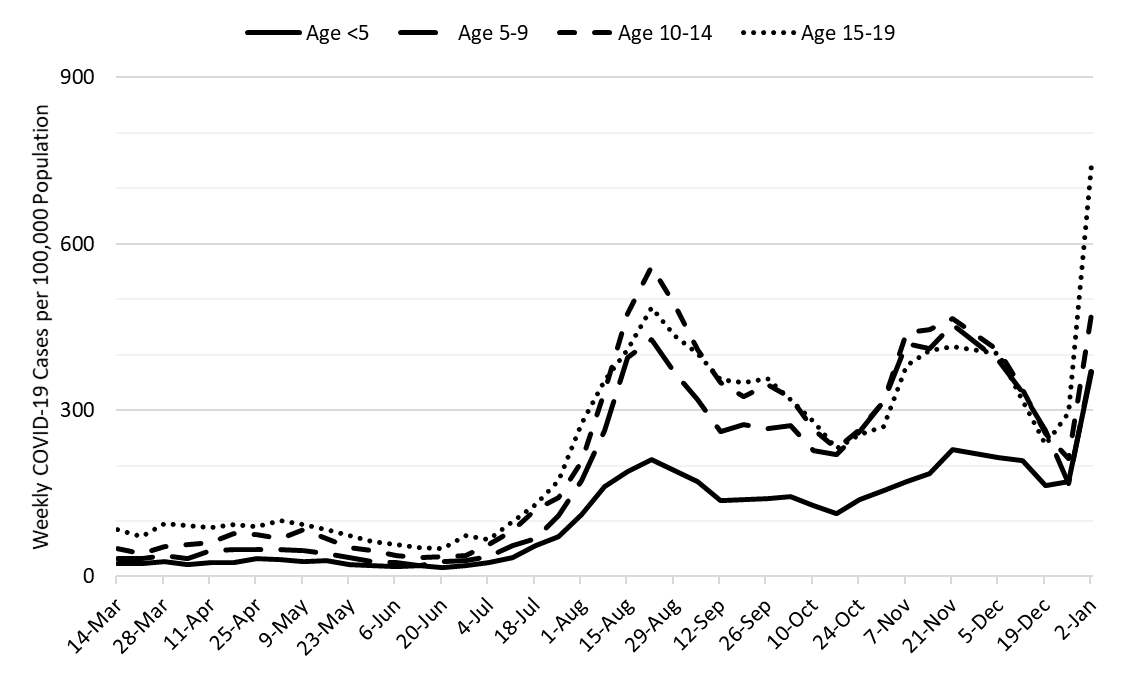
Figure 2a shows transmission among all age groups is increasing; however, the largest increases are among adolescents and working-age adults. These findings are consistent with Omicron’s early impact in other states and countries. Figure 2b shows transmission among children is also increasing with the largest increases among adolescents. Resumption of in-person activities among K – 12 and higher education couldn’t occur at a worse time. Given the background rate of community transmission, many schools will struggle to implement effective mitigation protections. Expect high rates of absenteeism among students, faculty, and staff throughout January.
|
Figure 2a. COVID-19 Cases in Arizona by Age Group March 7 – January 2, 2022 (Data from week ending November 28 suppressed). |
|
Figure 2b. COVID-19 Cases in Arizona among Children by Age Group March 7 – January 2, 2022. (Data from week ending November 28 suppressed). |
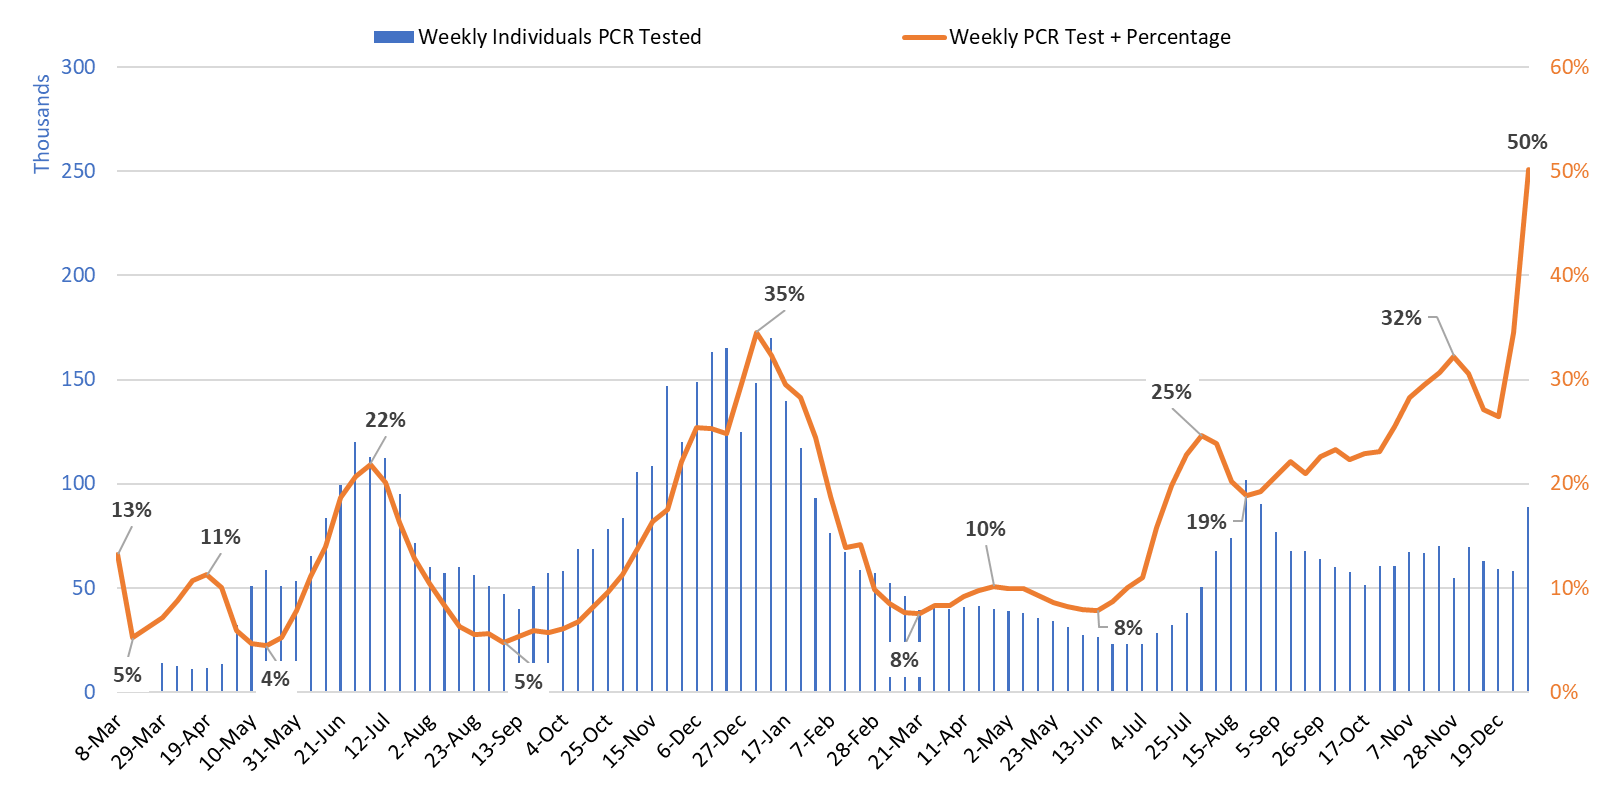
Test positivity exploded this week rising to 50%. Obviously, testing remains inadequate for public health practice and many cases are going undiagnosed (Figure 3). Test positivity below = individuals with any positive test in the past week / all unique individuals who have a test result in the past week. This formula will tend to yield higher values than elsewhere. At-home tests, also contribute to under-reporting because few results are transmitted to authorities.
|
Figure 3. Weekly Number of Patients Undergoing Traditional Nasopharyngeal PCR Testing and Associated Percent Positivity March 1, 2020 – January 2, 2022. |
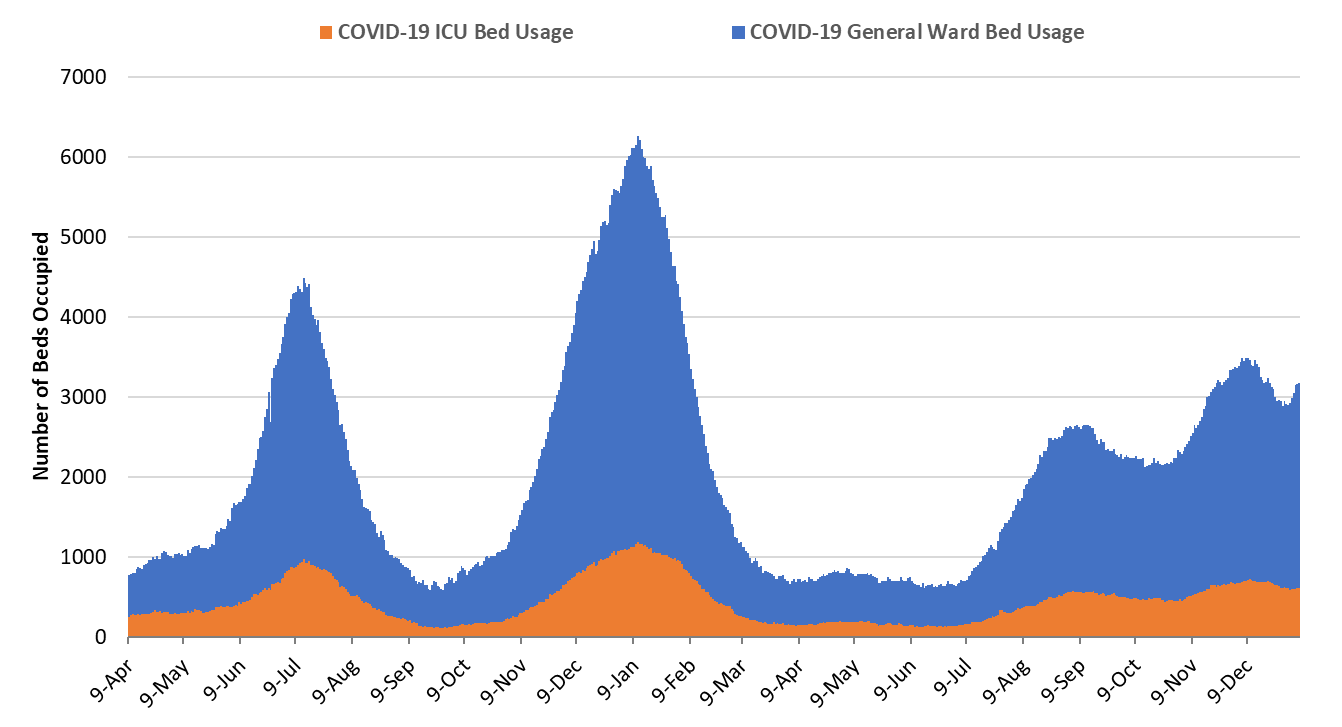
As of January 6th, 2562 (29%) of Arizona’s 8769 general ward beds were occupied by COVID-19 patients, a 12% increase from last week’s 2283 occupied beds (Figure 4 and Figure 5 Panel A). Another 483 (5%) beds remained available for use which is lower than last week’s 555 available beds. Six-hundred eight (608, 37%) of Arizona’s 1667 ICU beds were occupied by COVID-19 patients, a 1% decrease from last week’s 613 occupied beds (Figure 4 and Figure 5 Panel B). An additional 95 (6%) ICU beds remained available for use which is lower than last week’s 116 beds.
|
Figure 4. Arizona Daily COVID-19 General Ward and ICU Census April 9, 2020 – January 6, 2022. |
While peak occupancy will not reach prior levels, the Delta, and now Omicron, waves have placed much higher levels of chronic stress on our health system. We have so far seen 146 consecutive days with a combined occupancy >2000 patients whereas the summer 2020 and winter 2021 waves saw 57 and 98 days, respectively. Until last week, we had experienced 37 consecutive days with >3000 combined occupancy whereas the summer 2020 and winter 2021 waves saw 35 and 78 days, respectively. After a 10-day respite over Christmas-New Years, we are once again >3000 combined occupancy (last 4 days).
|
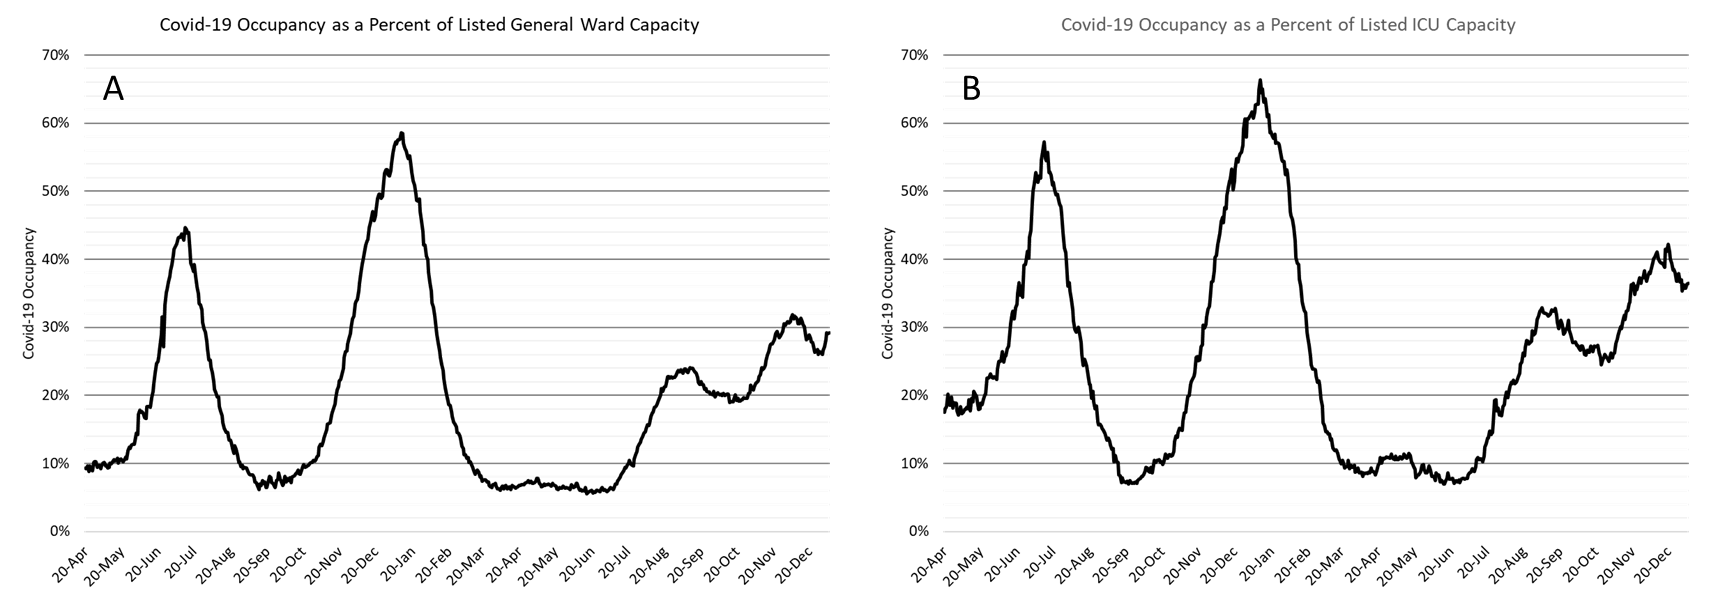
Figure 5. COVID-19 Occupancy as a Percent of Listed General Ward (A, left) and ICU (B, right) Capacity in Arizona April 20, 2020 – January 6, 2022. |
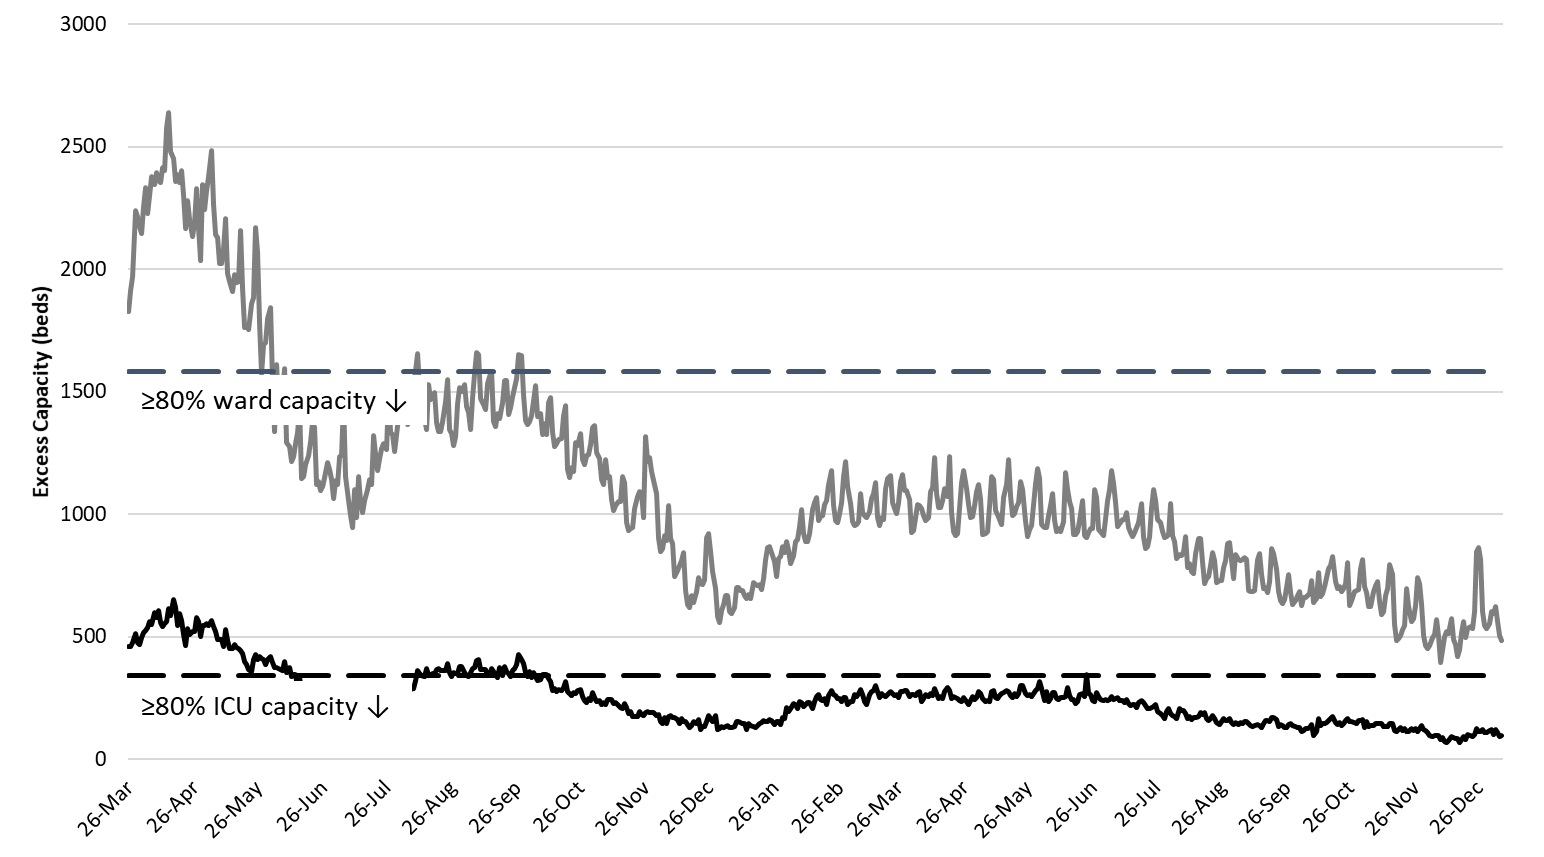
Hospital occupancy remains far above seasonal levels with safety margins, as measured by available beds, just above historical lows (Figure 6). Hospitals should prepare for >25% ward occupancy and >35% ICU occupancy for some time to come. There is no let-up in sight!
|
Figure 6. Observed Excess Non-Surge General Ward and ICU Capacity in Arizona March 26, 2020 – Jan 6, 2022. |
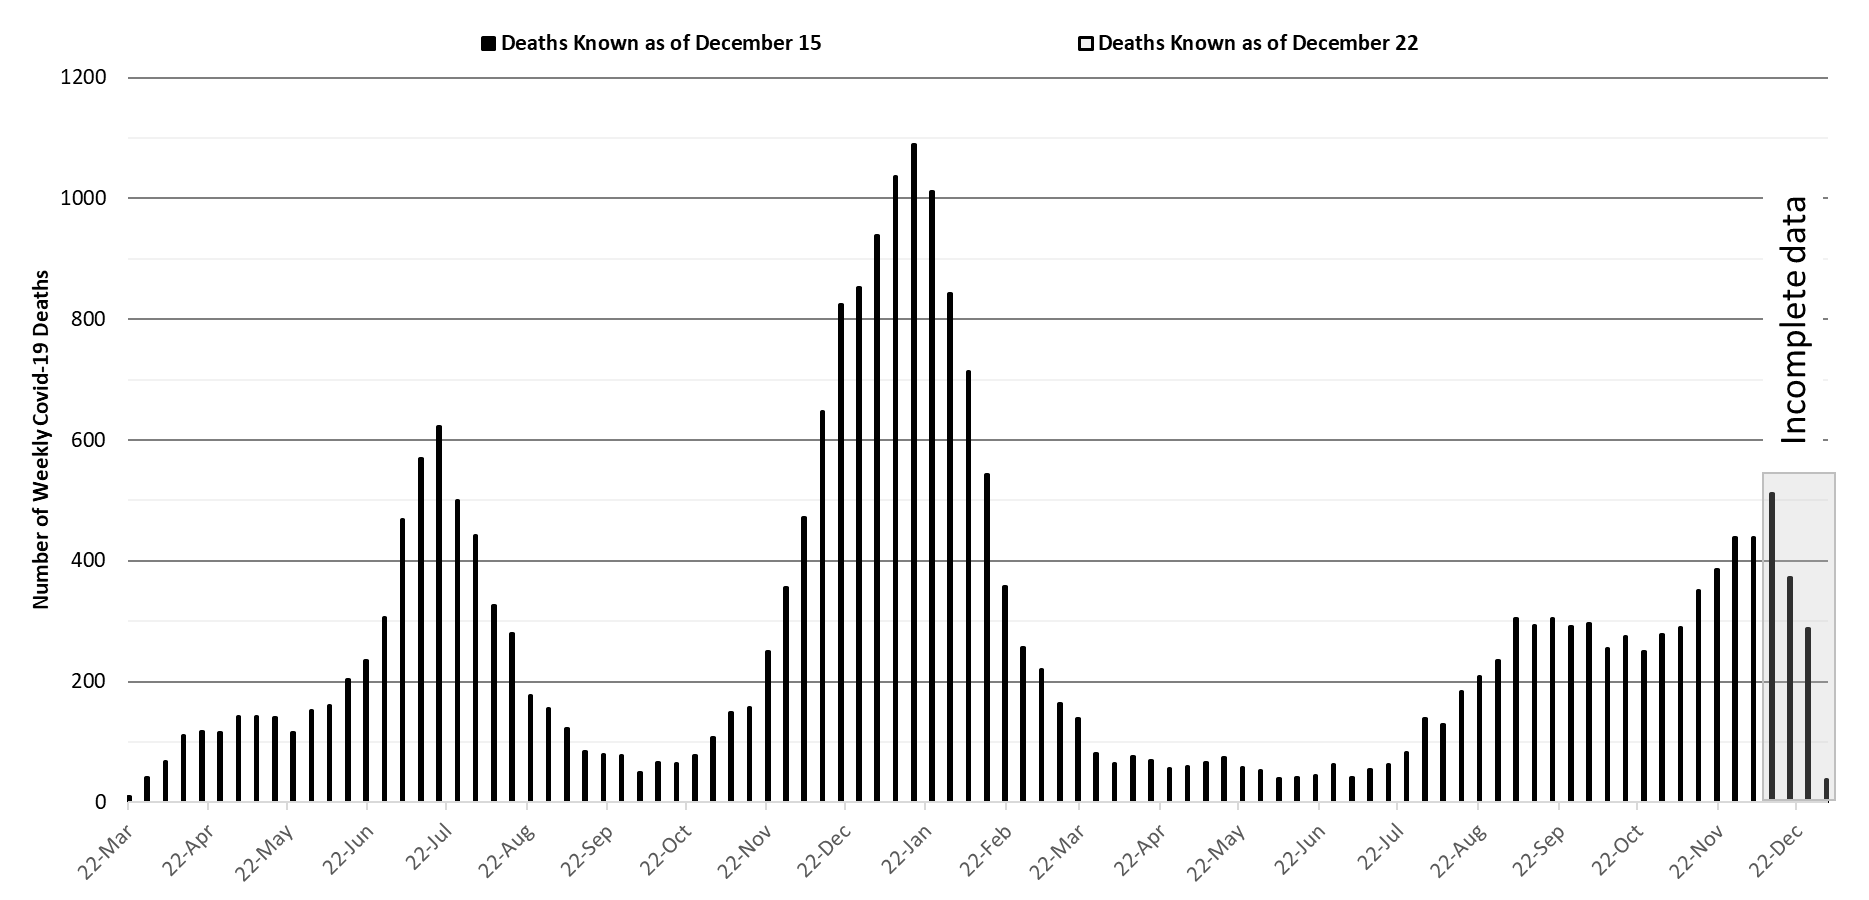
The week ending December 12th has now recorded 511 deaths to date, crossing the 500 deaths per week threshold for the first time during the Delta wave (Figure 7). At least 24616 Arizonans have lost their lives to COVID-19. However, as an updated mortality report from the Arizona Public Health Association indicates, excess deaths are considerably higher than the official COVID-19 death statistics. Also, a new report indicates the life expectancy fell the largest amount in 75 years from 78.8 years (2019) to 70.0 years (2020), a drop of 1.8 years.
|
Figure 7. Weekly Arizona COVID-19 Deaths March 16, 2020 – January 2, 2022. |
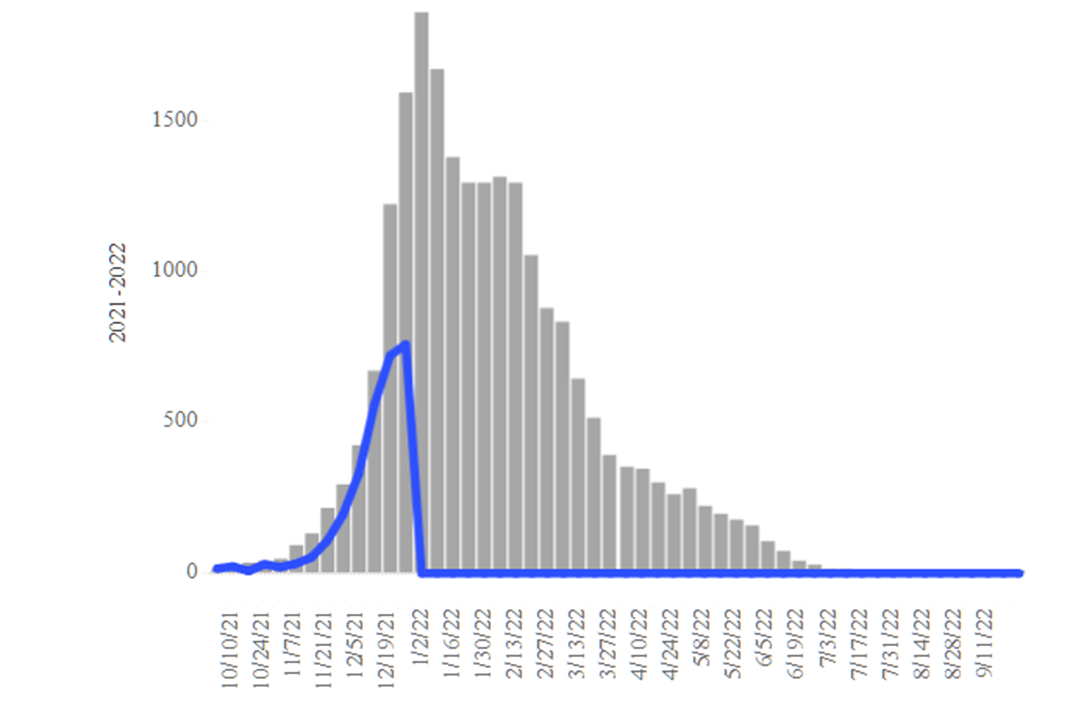
Seasonal influenza cases in Arizona (blue line) remain below the 5-year historical average (grey bars, Figure 8) with a marked departure over the past two weeks suggesting individual COVID-19 mitigation efforts may be paying dividends for the less transmissible flu virus. Continued observation over the next 4 weeks is warranted.
|
Figure 8. Arizona Influenza Cases in 2021 (blue) versus 5-Year Historical Average (grey) |
Pima County Outlook
For the week ending January 2nd, 5858 Pima County residents were diagnosed with COVID-19, a 125% increase from the initial tally of 2607 cases last week (Figure 9).
|
Figure 9. Weekly COVID-19 Cases in Pima County and Number of Individuals Undergoing COVID-19 Diagnostic Testing March 1, 2020 – January 2, 2022. |
Trends across the various age groups show rapidly increasing local transmission across all age groups consistent with the overall state data (Figure 10).
|
Figure 10. COVID-19 Cases in Pima County by Age Group March 7, 2020 – January 2, 2022. (Data from week ending November 28 are suppressed). |
Summary
- Arizona is experiencing historic levels of community transmission attributable to the newly dominant Omicron variant. Test positivity is extremely high reminding us that test capacity, accessibility, and/or uptake is wholly inadequate. Arizona, like much of the United States, is in the midst of another large pandemic wave. Expect transmission to peak in late January with very large numbers of hospitalizations continuing into February. The greatest burden on our health care system will shift towards emergency department and general wards and away from our ICU facilities.
- As of January 2nd, new cases were being diagnosed at a rate of 731 cases per 100K residents per week. Given the experience of eastern states, we can expect this rate to at least triple before the end of the month.
- Mask mandates are urgently needed at municipal and county levels to reduce transmission, blunt the worst of the Omicron wave, and relieve overwhelmed hospitals. Regardless of public action, individuals should mask in indoor settings using a well-fitting KN-95 or better mask.
- Waning vaccine immunity makes it imperative that all adults who were previously vaccinated obtain a booster, particularly those 50+ years of age.
- Risk factors for breakthrough hospitalization and death were recently elucidated in the British Medical Journal: https://www.bmj.com/content/374/bmj.n2244. These findings were replicated in the MMWR with poor outcomes among those age >40 years, immunocompromised or with underlying chronic illness. https://www.cdc.gov/mmwr/volumes/71/wr/mm7101a4.htm
- COVID-19 hospital occupancy is once again increasing and should continue to do so throughout January. Hospitals should prepare for >25% occupancy in general wards and >35% occupancy in the ICU. Access to care will continue to be even further restricted in the face of looming staff shortages owing to infections among healthcare workers.
- January is poised to be a very difficult month for Arizona hospitals with the tail of the Delta wave, below average but still meaningful seasonal influenza, and a large Omicron wave.
- While not ideal, the 2-dose Pfizer primary sequence provided 70% protection against hospitalization in South Africa during their Omicron wave. Therefore, our immunity wall may hold just enough to prevent collapse of our hospital systems, but it will be close https://www.nejm.org/doi/full/10.1056/NEJMc2119270
- For those willing to read, INARC has released a detailed report documenting how Omicron changed utilization and outcomes among ICUs in England. https://www.icnarc.org/our-audit/audits/cmp/reports
- Weekly COVID-19 deaths have now reached 500 per week and should remain near this level even in the face of growing community immunity and less virulent Omicron variant. So far, 24616 Arizonans have lost their lives to COVID-19.
- As an updated mortality report from the Arizona Public Health Association indicates excess deaths are considerably higher than the official COVID-19 statistics.
- The CDC recently documented the largest decline in life expectancy in 75 years https://www.cdc.gov/nchs/products/databriefs/db427.htm
- The United Kingdom continues to publish excellent summaries of Omicron’s impact (Dec 31): https://assets.publishing.service.gov.uk/government/uploads/system/uploads/attachment_data/file/1044481/Technical-Briefing-31-Dec-2021-Omicron_severity_update.pdf
Forecast reports to date, available as PDFs
Download PDF to view additional charts of Arizona counties, available in appendix of report.
January 7
2021 Reports
Based on what we know now about this pandemic, we support guidelines for social distancing to slow the spread of the virus and urge everyone to follow the recommendations provided by the Centers for Disease Control and Prevention (CDC) to protect yourself, your family, your neighbors, and your employees. Please heed the recommendations as provided by the CDC.
COVID covid coronavirus virus covid19 corona forecast model

