


Note this forecast page is not the most recent forecast available.
View the most current forecast report
Researcher Analyzes Arizona COVID-19 Spread Models for Decision-Makers
The following information regarding the spread of COVID-19 in Arizona was prepared by Joe Gerald, MD, PhD, a researcher at the Mel and Enid Zuckerman College of Public Health (MEZCOPH) at the University of Arizona. This information has also been reviewed by other MEZCOPH faculty.
This data were obtained from the Arizona Department of Health Services COVID-19 webpage and reflect conditions in Arizona as of November 5, 2021.
This information is intended to help guide our response to the outbreak. It is not intended to predict how this pandemic will evolve. Rather, this model extrapolates what might occur if current conditions remain unchanged. As regional authorities and healthcare providers respond, their actions are expected to mitigate the worst consequences of this pandemic.

COVID-19 Disease Outbreak Forecast
Arizona State and Pima County
Updated November 5, 2021
Disclaimer: This information represents my personal views and not those of The University of Arizona, the Zuckerman College of Public Health, or any other government entity. Any opinions, forecasts, or recommendations should be considered in conjunction with other corroborating and conflicting data. Updates can be accessed at https://publichealth.arizona.edu/news/2021/covid-19-forecast-model.
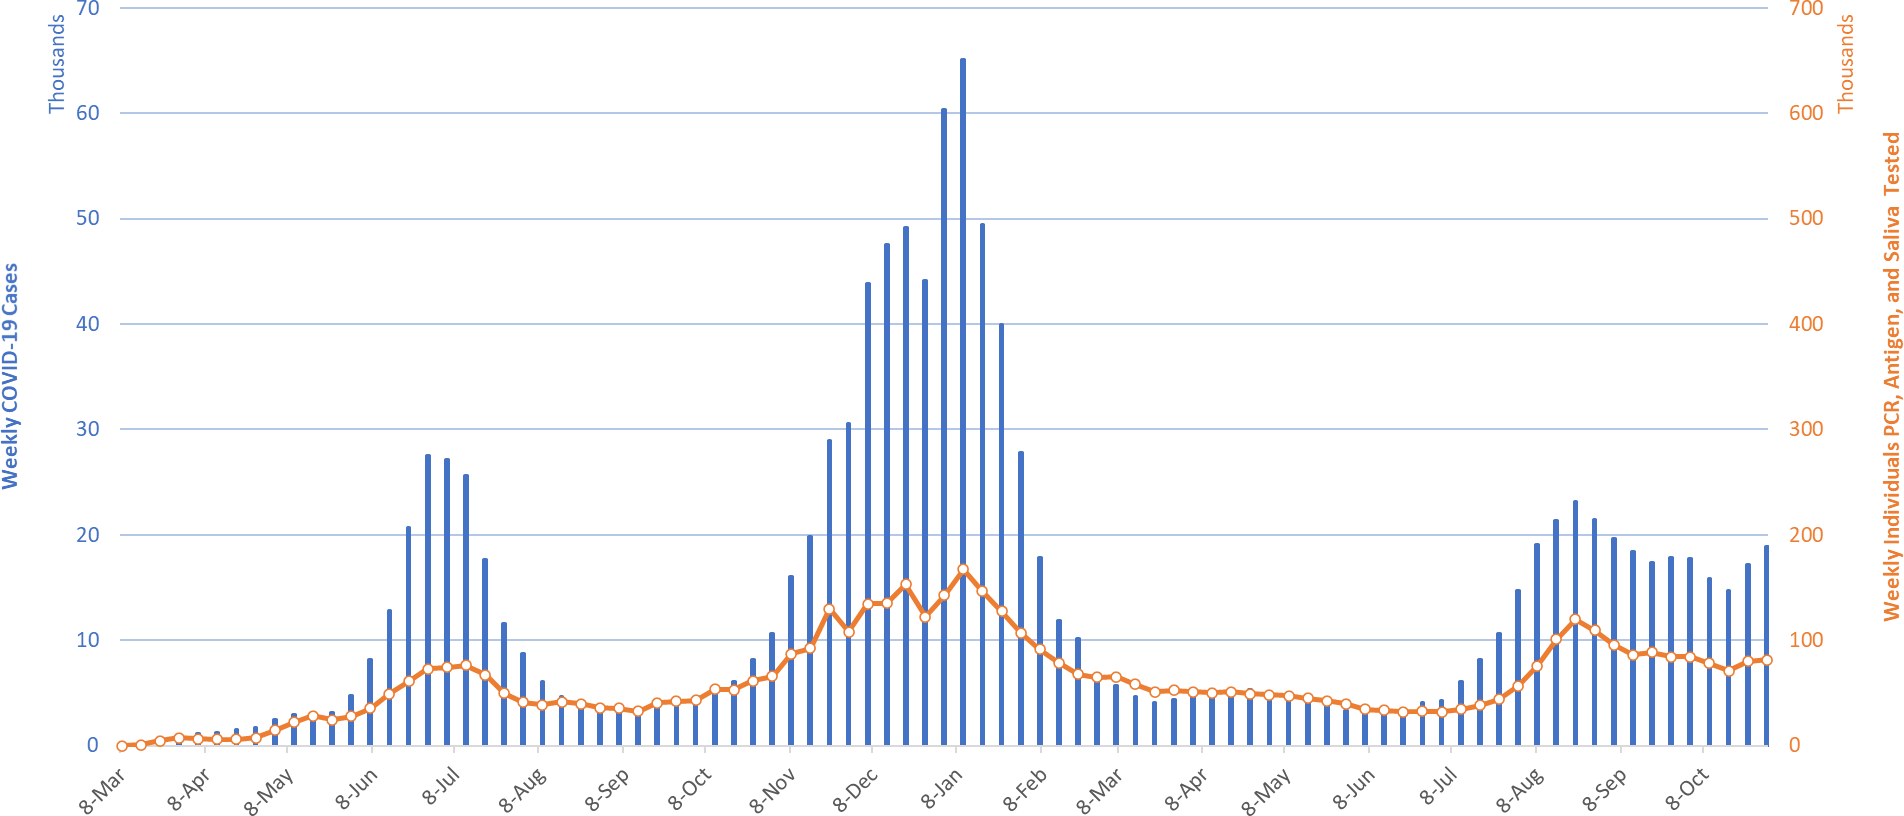
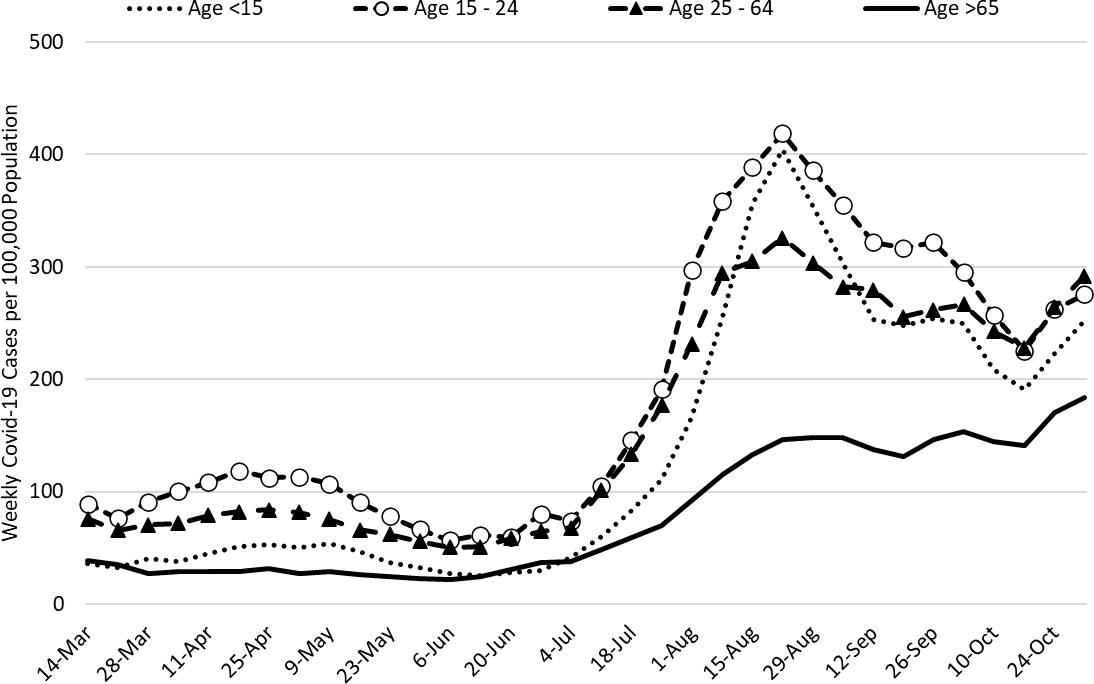
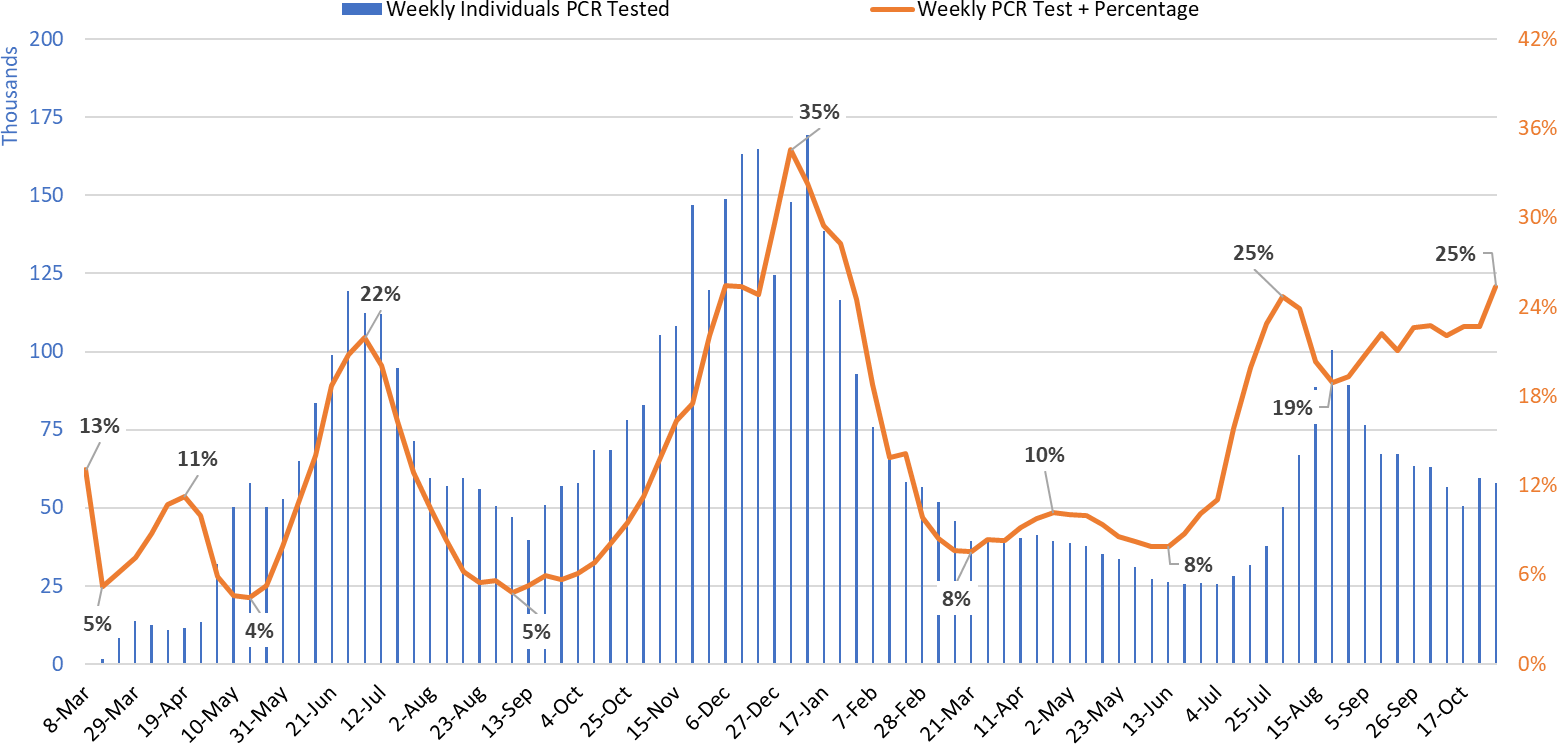
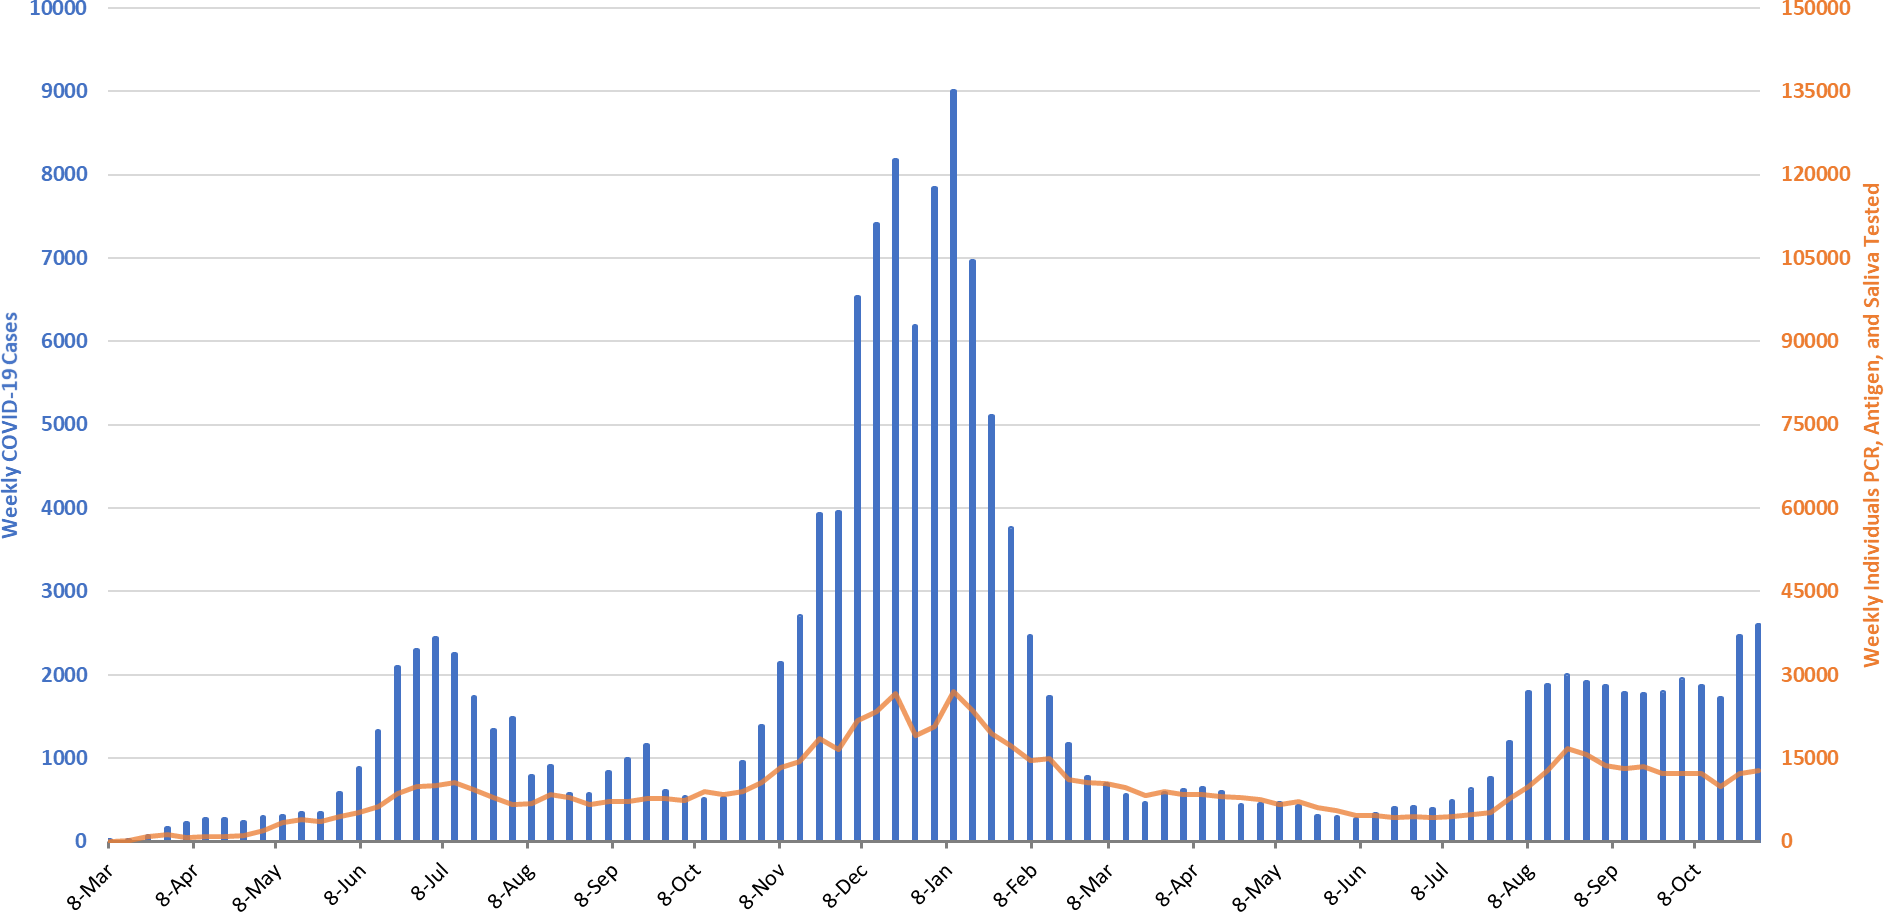
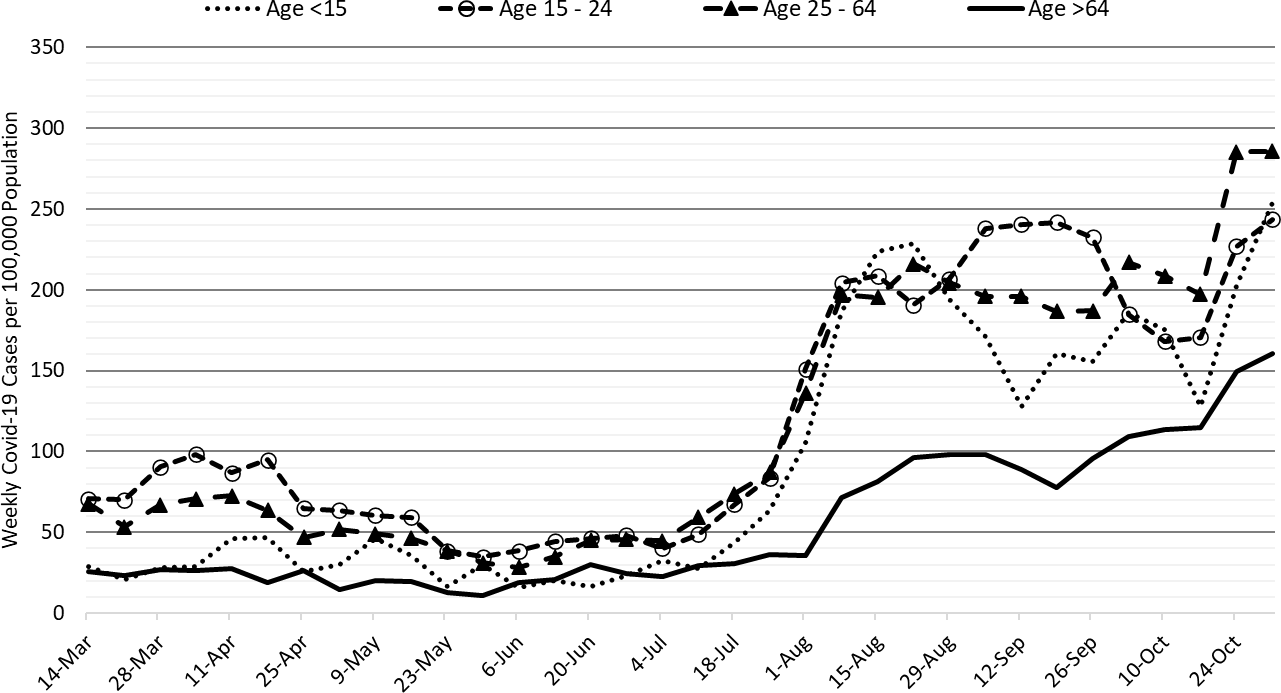
For the week ending October 31st, 18296 Arizonans were diagnosed with COVID-19, a 6% increase from last week’s tally of 17212 cases (Figure 1). Over the past 2 weeks, transmission has unexpectedly increased 25% from 203 cases per 100K residents per week (declining by 19 cases per week) to 260 cases per 100K residents per week (increasing by 24 cases per 100K residents per week). Only time will tell if this is a permanent shift in transmission dynamics. Rates are highest among those 25 – 64 years and are the lowest among those 65+ years, 292 versus 184 cases per 100K residents per week, respectively (Figure 2a below).
|
Figure 1. Weekly COVID-19 Cases in Arizona and Number of Individuals Undergoing COVID-19 Diagnostic Testing March 1, 2020 – October 31, 2021. |
Arizona continues to experience a persistently high number of cases, hospitalizations, and deaths. With waning vaccine efficacy and a potentially short duration of acquired immunity, herd immunity is not achievable. As winter approaches, more previously vaccinated and previously infected individuals will become susceptible. While these individuals will remain protected from severe outcomes, they will contribute to community transmission. Unvaccinated Arizonans will not be able to avoid infection by “free riding” on high levels of community immunity. The decision to remain unvaccinated carries a much greater risk than getting vaccinated does. Hopefully, Merck’s new antiviral molnupiravir will be available soon as it was just approved by the UK.
Arizona’s new case ranking has moved up 5 spots to 16th. The nation’s leaders are Alaska (584), Montana (458), North Dakota (448), Wyoming (430), and New Hampshire (393). However, rates in these states have peaked and are generally declining. According to the CDC, 64% of Arizona adults are fully vaccinated and another 9% have received one dose; however, only 26% of Arizonans 65+ years have received a booster placing us 42nd overall. As winter approaches, waning immunity among those without a booster will place them at risk. The CDC guidance on boosters now includes guidance for each vaccine. The ADHS Vaccine Dashboard shows weekly doses delivered surged to 150K doses, many of which are third dose boosters, good news!
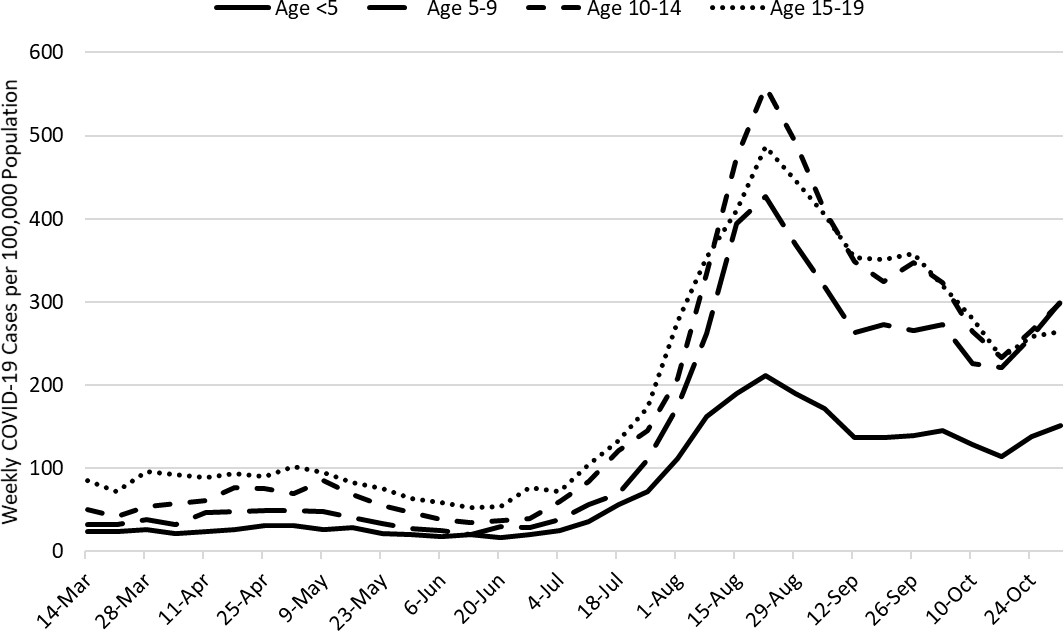
Figure 2a shows an abrupt increase in transmission among all age groups starting early-mid October, even among those 65+ years who have high levels of vaccination. A similar pattern is evident among school-age children (Figure 2b). Low vaccination uptake, ineffectual or absent mitigation efforts, and waning immunity are ultimately to blame for our circumstances but the cause of this most recent uptick during a relatively stable policy environment is unclear. While a recent cold front dropped average temperatures by 10 -15 degrees beginning October 8th, the upswing also coincides with fall break for many K -12 schools. Who knows?
The Arizona Supreme Court unanimously ruled that recent legislation banning schools from requiring mask use was unconstitutional. While preventing a ban is better than allowing one, this ruling simply prevents the legislature from making a bad situation worse. Optimal policy would have been to require, not prohibit, face coverings in all K – 12 settings at the beginning of the school year before child vaccine approval was granted.
|
Figure 2a. COVID-19 Cases in Arizona by Age Group March 7 – October 31, 2021. |
|
Figure 2b. COVID-19 Cases in Arizona among Children by Age Group March 7 – October 31, 2021. |
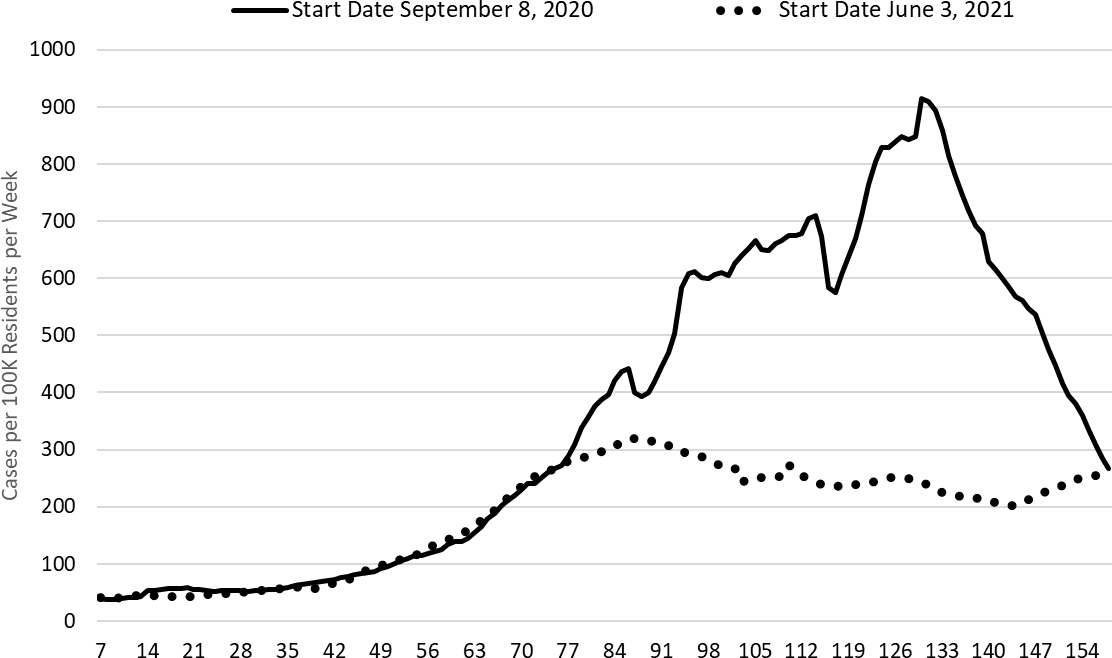
After 158 days, case rates during the past winter 2020 surge and this current one have intersected (Figure 2c). While this wave never generated a high peak, its base may end up being considerably broader as it could “slow burn” into 2022. If so, its impact will undoubtedly be larger than that of the summer 2020 wave and could approach that of the winter 2021 wave given time. COVID-19 is not done with us yet and may never be!
|
Figure 2c. COVID-19 Cases in Arizona by Age Group Week Ending October 18, 2020 versus October 17, 2021. |
Test positivity, at 25%, continues to edge up (Figure 3). Testing is inadequate for public health practice and many cases are going undiagnosed. Recent trends are radically different from the resolution of the past 2 waves which saw rapidly declining positivity after the peak. Not sure what explains the difference now or what significance to attach to it other than the obvious fact that transmission remains high on a low testing base.
|
Figure 3. Weekly Number of Patients Undergoing Traditional Nasopharyngeal PCR Testing and Associated Percent Positivity March 1, 2020 – October 31, 2021. |
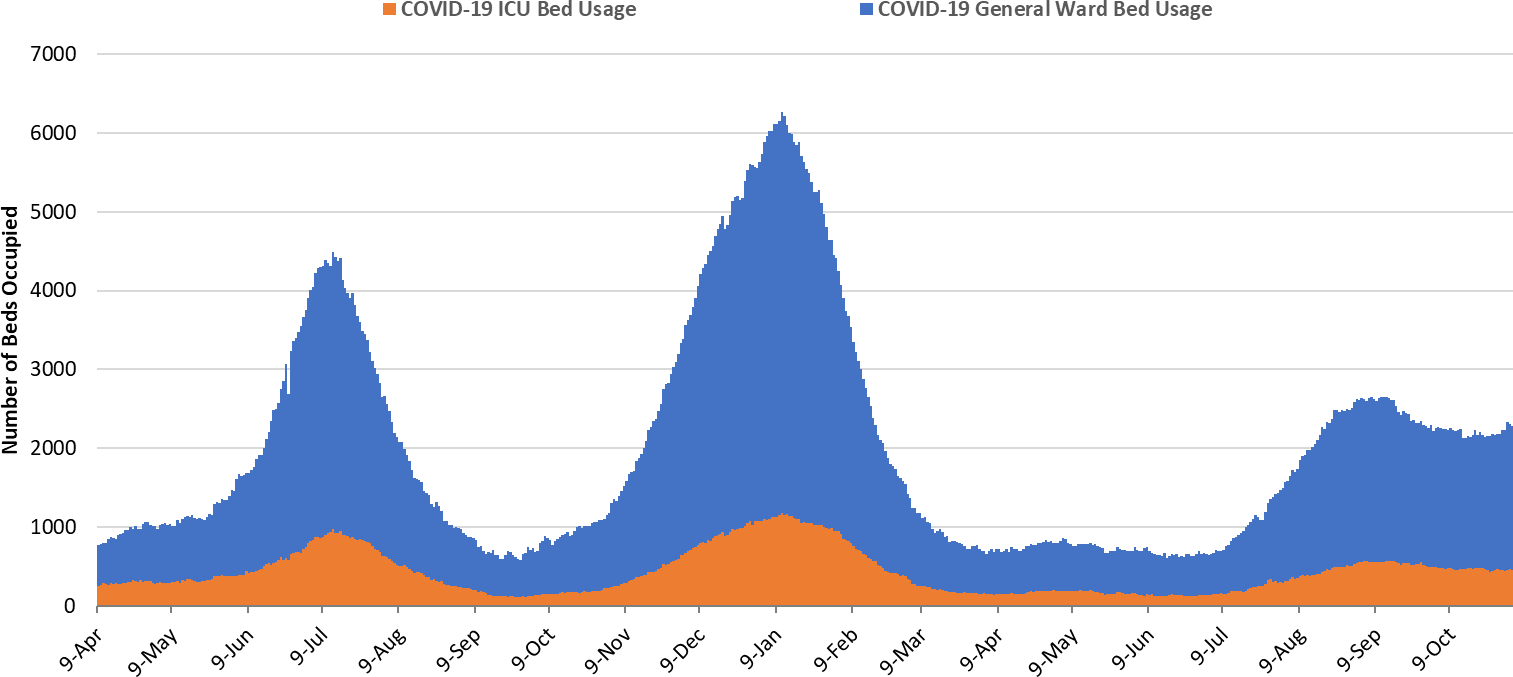
As of November 3rd, 1828 (21%) of Arizona’s 8778 general ward beds were occupied by COVID-19 patients, a 7% increase from last week’s 1714 occupied beds (Figure 4 and Figure 5 Panel A). Another 679 (8%) beds remained available for use. The number of available ward beds is a bit higher than last week’s 647 beds. Four- hundred fifty-three (453, 26%) of Arizona’s 1778 ICU beds were occupied by COVID-19 patients, a 0% decrease from last week’s 454 occupied beds (Figure 4 and Figure 5 Panel B). An additional 153 (9%) ICU beds remained available for use, similar to last week’s 155 beds.
|
Figure 4. Arizona Daily COVID-19 General Ward and ICU Census April 9, 2020 – November 3, 2021. |
While peak occupancy with this third wave never reached levels seen in the prior two, the base of the wave has the potential to be broader. For example, the summer 2020 and winter 2021 waves saw 57 and 98 days with combined ward and ICU occupancy >2000 patients, respectively. So far, this current wave has seen 83 days with a combined occupancy >2000 patients with no resolution in sight. Persistently high COVID-19 occupancy will have important implications through our seasonal peak occupancy in February.
|
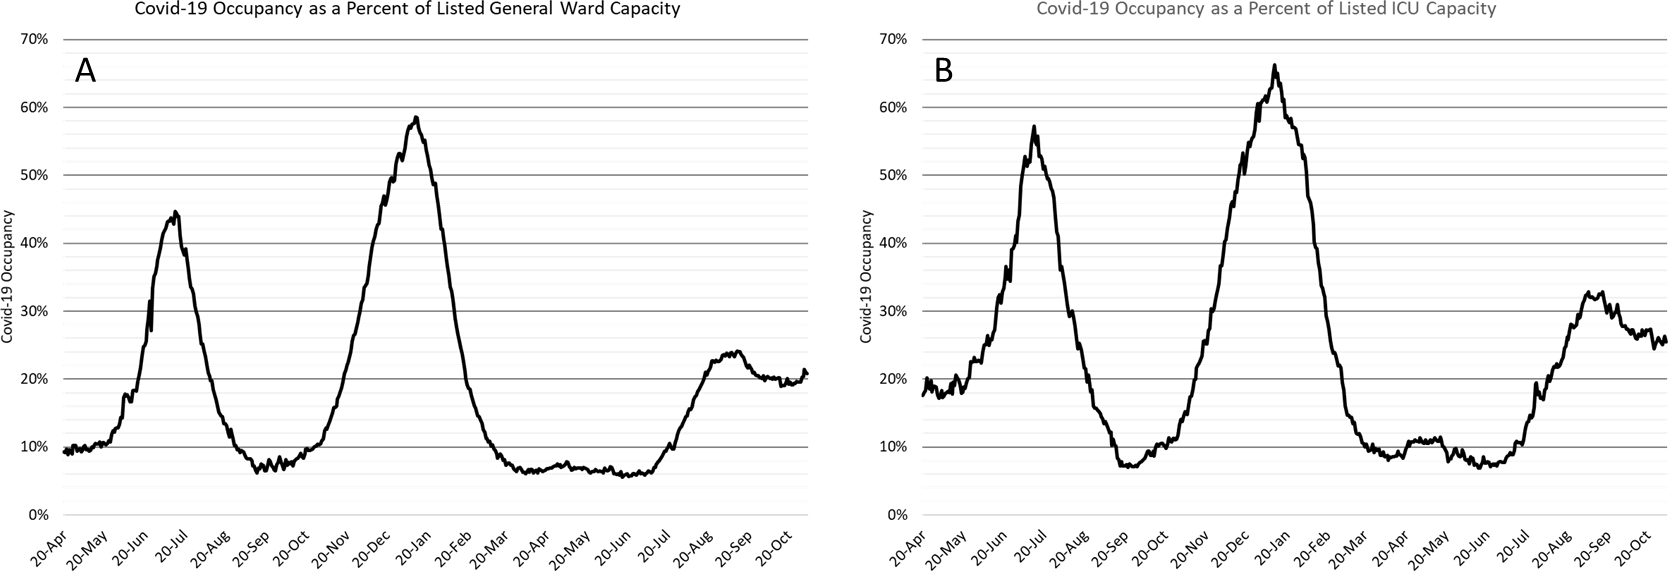
Figure 5. COVID-19 Occupancy as a Percent of Listed General Ward (A, left) and ICU (B, right) Capacity in Arizona April 20, 2020 – November 3, 2021. |
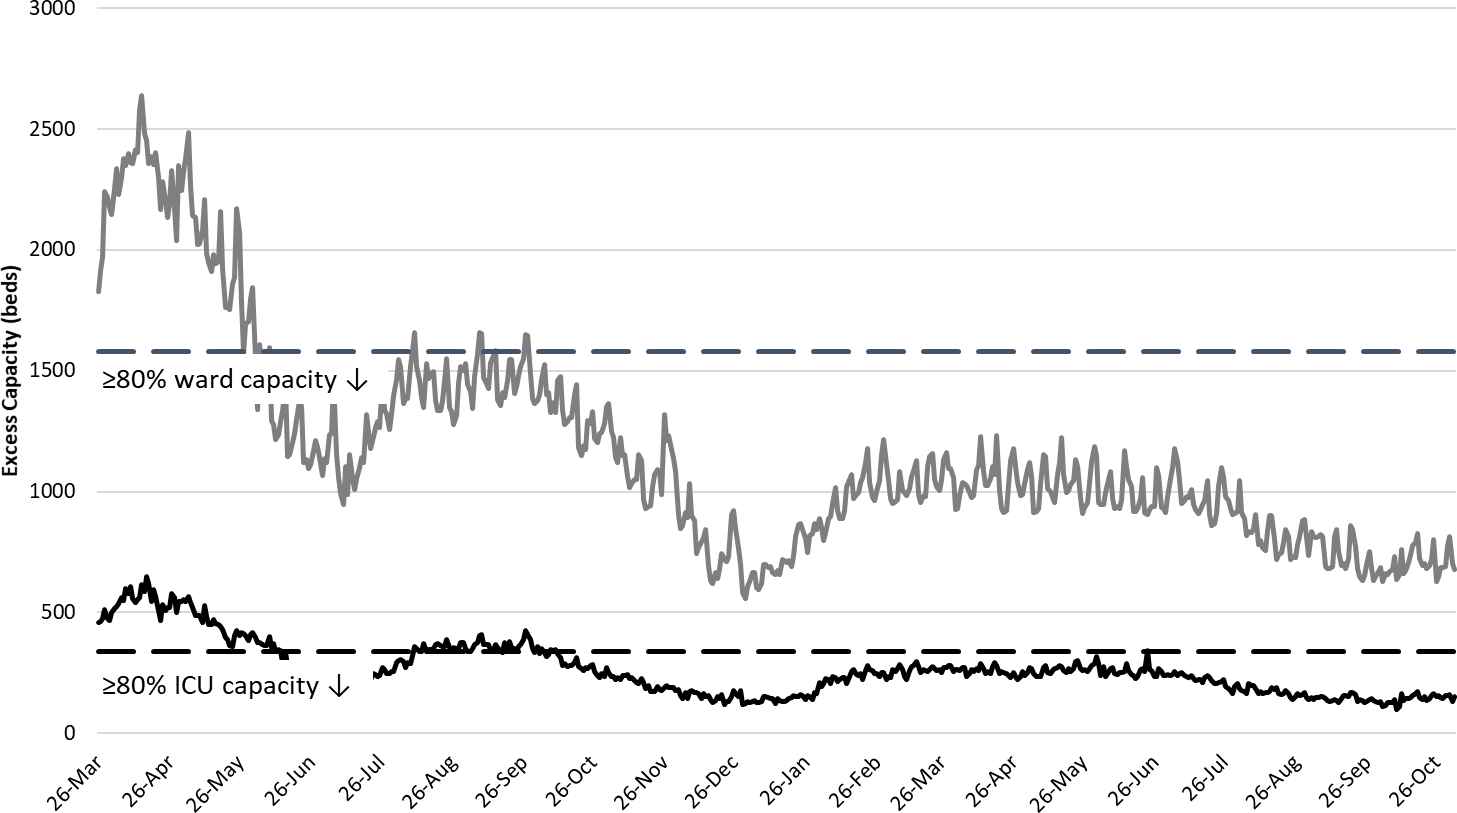
Arizona hospital occupancy remains far above seasonal levels. Safety margins, as measured by excess available beds, remain quite low (Figure 6). Hospitals should be prepared for >15% ward occupancy and >20% ICU occupancy for some time to come.
|
Figure 6. Observed Excess Non-Surge General Ward and ICU Capacity in Arizona March 26, 2020 – Nov 3, 2021. |
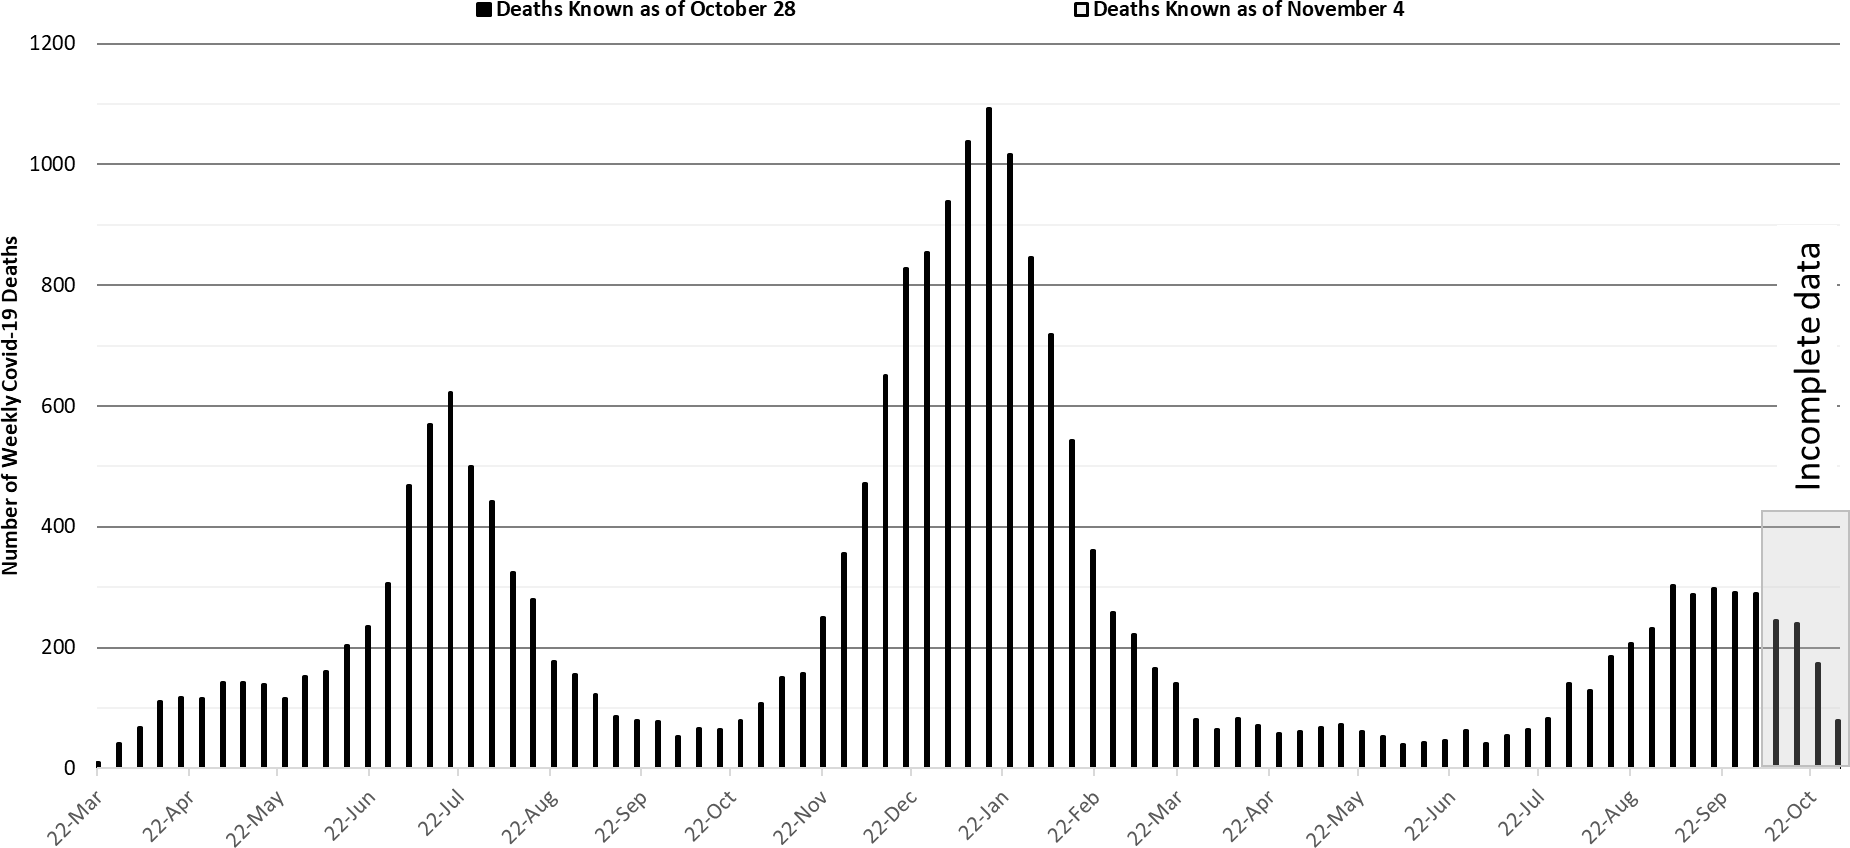
Arizona has been experiencing >200 COVID-19 deaths per week since August 22nd. The week ending September 5th has now recorded 302 deaths (Figure 7). The weeks ending September 12th and 19th are close behind with 288 and 298 deaths, respectively. So far, 21348 Arizonans have lost their lives to COVID-19 making it Arizona’s leading cause of death, the only state to achieve such a distinction.
|
Figure 7. Weekly Arizona COVID-19 Deaths March 16, 2020 – October 31, 2021. |
Pima County Outlook
For the week ending October 31st, 2602 Pima County residents were diagnosed with COVID-19 a 6% increase from last week’s tally and 54% increase from two weeks ago (Figure 8).
|
Figure 8. Weekly COVID-19 Cases in Pima County and Number of Individuals Undergoing COVID-19 Diagnostic Testing March 1, 2020 – October 31, 2021. |
New cases are being diagnosed at a rate of 249 cases per 100K residents per week and this rate is increasing by 14 cases per 100K residents per week. Trends across the various age groups appear in Figure 9.
|
Figure 9. COVID-19 Cases in Pima County by Age Group March 7, 2020 – October 31, 2021. |
Summary
- Arizona continues to experience high levels of community transmission with case rates unexpectedly climbing 25% in the past 2 weeks. Test positivity remains high reminding us that test capacity, accessibility, and/or uptake is inadequate to meet public health needs. Increasing case rates among older, highly vaccinated groups serves as a warning that major behavioral shifts and/or waning immunity could result in future increases in not only cases but also hospitalizations.
- As of October 31st, new cases were being diagnosed at a rate of 260 cases per 100K residents per week. The rate was increasing by 24 cases per 100K residents per week.
- Waning vaccine efficacy and a short duration of acquired immunity means the unvaccinated cannot “free ride” on high levels of community immunity. Persistently high levels of community transmission, and more importantly hospitalizations, are possible for an extended time until the supply of unvaccinated, previously uninfected adults is exhausted. https://www.science.org/doi/10.1126/science.abm0620
- Waning vaccine immunity also makes it imperative that those who were previously vaccinated accept a third shot booster, particularly those 50+ years of age. While vaccination provides greater durability of protection for severe illness than mild reinfection, a third dose booster provides important incremental benefits to individuals, families, and communities. https://jamanetwork.com/journals/jama/fullarticle/2786040
- Vaccination remains the most important public health priority to reduce transmission and severe illness; however, mask mandates, restrictions on indoor gatherings, and targeted business mitigations are still needed to reduce/control transmission in the short-run with the primary goal being to avoid overwhelming our critical care facilities and reducing pressure for new vaccine-escape variants.
- The FDA/CDC now recommends booster shots for all 3 vaccine brands; they have also broadened the language for booster eligibility https://www.cdc.gov/coronavirus/2019-ncov/vaccines/booster-shot.html
- For those residing in unvaccinated households, considerable benefit accrues if any one member becomes vaccinated. So, there is something you can do (get vaccinated) even if others remain hesitant. https://jamanetwork.com/journals/jamainternalmedicine/fullarticle/2785141
- COVID-19 hospital occupancy is holding steady and will likely exceed 15% of all beds in the general ward and 20% of beds in the ICU for the remainder of the year. Access to care will continue to be restricted in the face of staff shortages in inpatient and outpatient settings.
- Weekly COVID-19 deaths continue to exceed 200 per week. The week ending September 5th has now recorded 302 deaths with several others just shy of this mark. While this wave is not as “peaked” as past waves, its base is broad and could over time cause substantial additional morbidity and mortality.
- Check out the AzPHA’s COVID-19 Mortality in Arizona report showing that COVID-19 was the leading cause of death in Arizona. https://azpha.org/2021/10/20/new-azpha-report-covid-19-has-been-the-leading-cause-of-death-during-the-pandemic-in-arizona/
- An updated analysis to be pushed by AzPHA on Monday shows that Arizona was the only state where this happened. This isn’t like the movies where an undisciplined team of misfits (Arizonans) with a poor coaching staff (governor and legislature) will win the championship. In the real world, your team loses, often by a lot! https://secureservercdn.net/166.62.110.60/p7p.8e2.myftpupload.com/wp-content/uploads/2021/11/AzPHA-Data-Brief-COVID-vs-Heart-Disease-and-Cancer-50-States-nov-3.pdf
Forecast reports to date, available as PDFs
Download PDF to view additional charts of Arizona counties, available in appendix of report.
November 5
2020 Reports
Based on what we know now about this pandemic, we support guidelines for social distancing to slow the spread of the virus and urge everyone to follow the recommendations provided by the Centers for Disease Control and Prevention (CDC) to protect yourself, your family, your neighbors, and your employees. Please heed the recommendations as provided by the CDC.
COVID covid coronavirus virus covid19 corona forecast model

