


Note this forecast page is not the most recent forecast available.
View the most current forecast report
Researcher Analyzes Arizona COVID-19 Spread Models for Decision-Makers
The following information regarding the spread of COVID-19 in Arizona was prepared by Joe Gerald, MD, PhD, a researcher at the Mel and Enid Zuckerman College of Public Health (MEZCOPH) at the University of Arizona. This information has also been reviewed by other MEZCOPH faculty.
This data were obtained from the Arizona Department of Health Services COVID-19 webpage and reflect conditions in Arizona as of September 24, 2021.
This information is intended to help guide our response to the outbreak. It is not intended to predict how this pandemic will evolve. Rather, this model extrapolates what might occur if current conditions remain unchanged. As regional authorities and healthcare providers respond, their actions are expected to mitigate the worst consequences of this pandemic.

COVID-19 Disease Outbreak Forecast
Arizona State and Pima County
Updated September 24, 2021
Disclaimer: This information represents my personal views and not those of The University of Arizona, the Zuckerman College of Public Health, or any other government entity. Any opinions, forecasts, or recommendations should be considered in conjunction with other corroborating and conflicting data. Updates can be accessed at https://publichealth.arizona.edu/news/2021/covid-19-forecast-model.
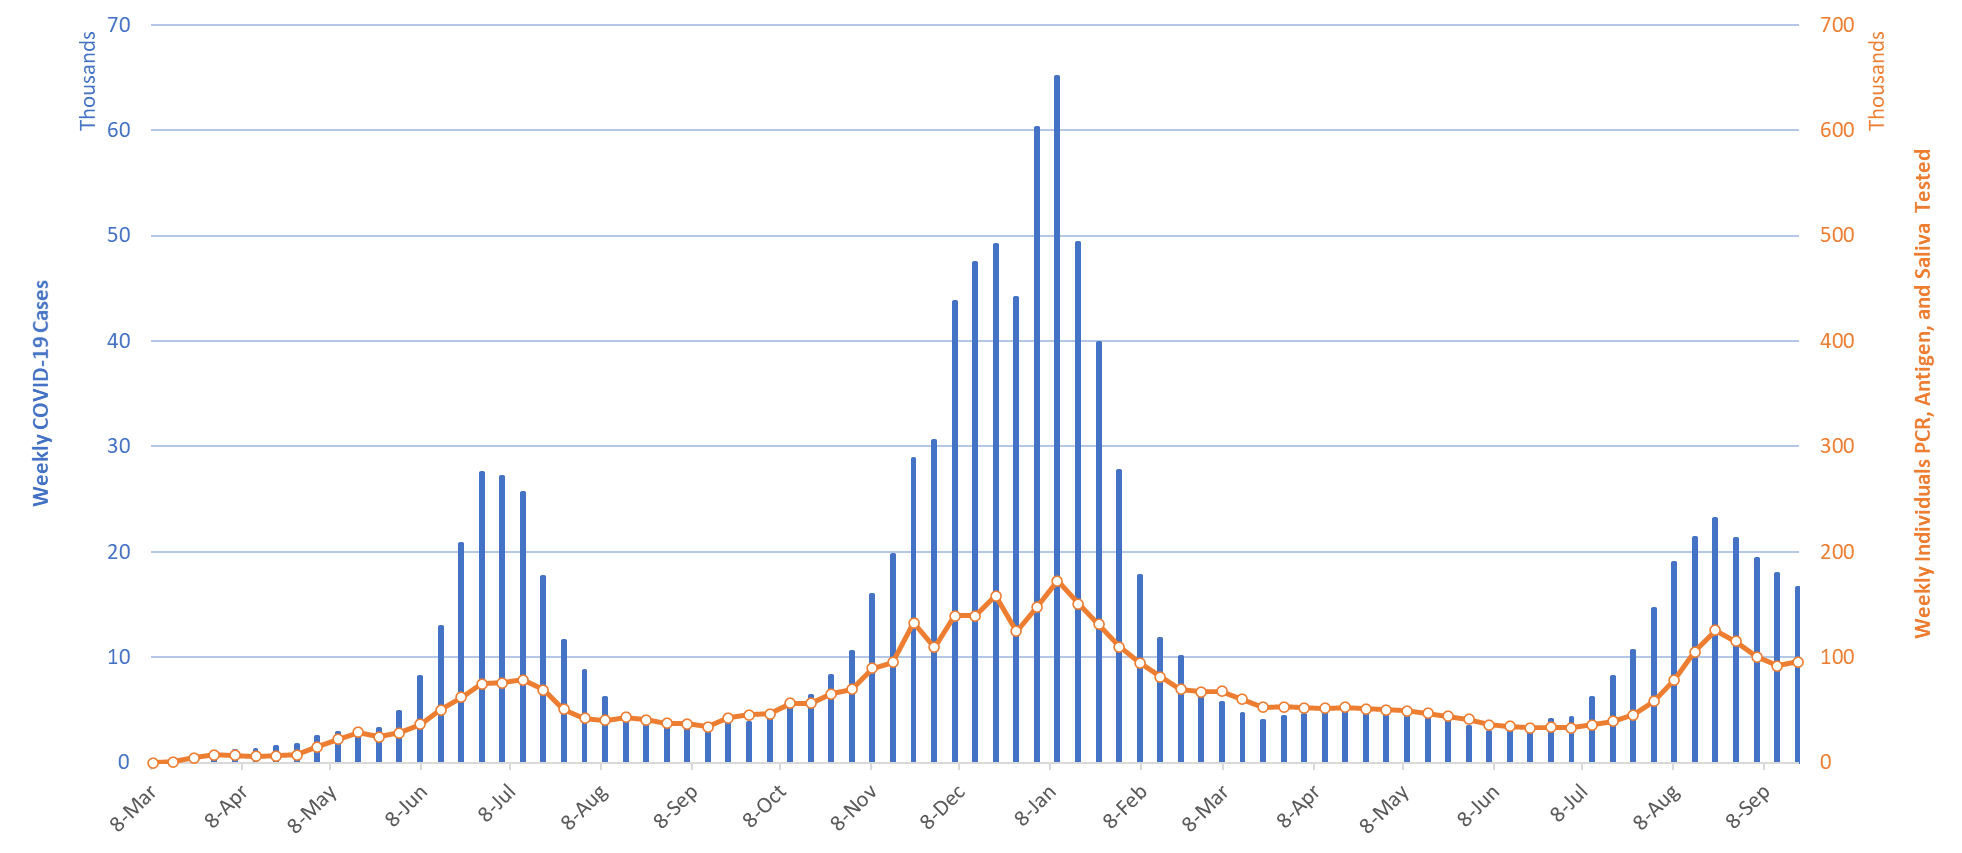
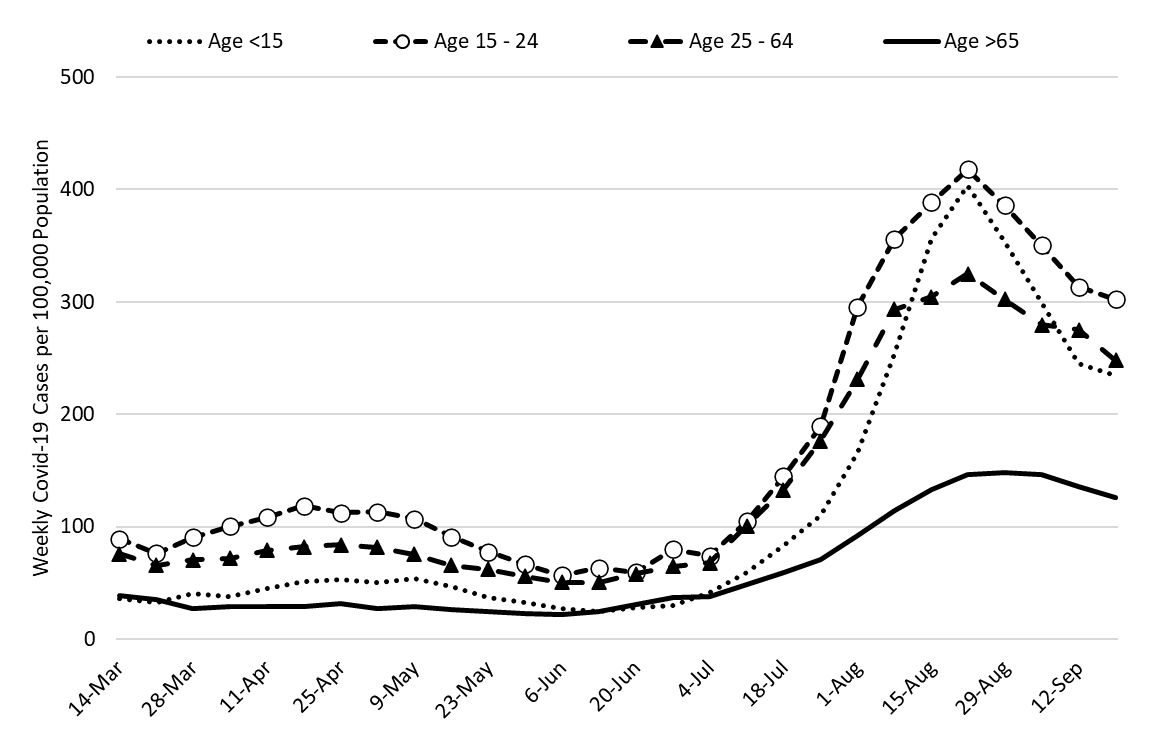
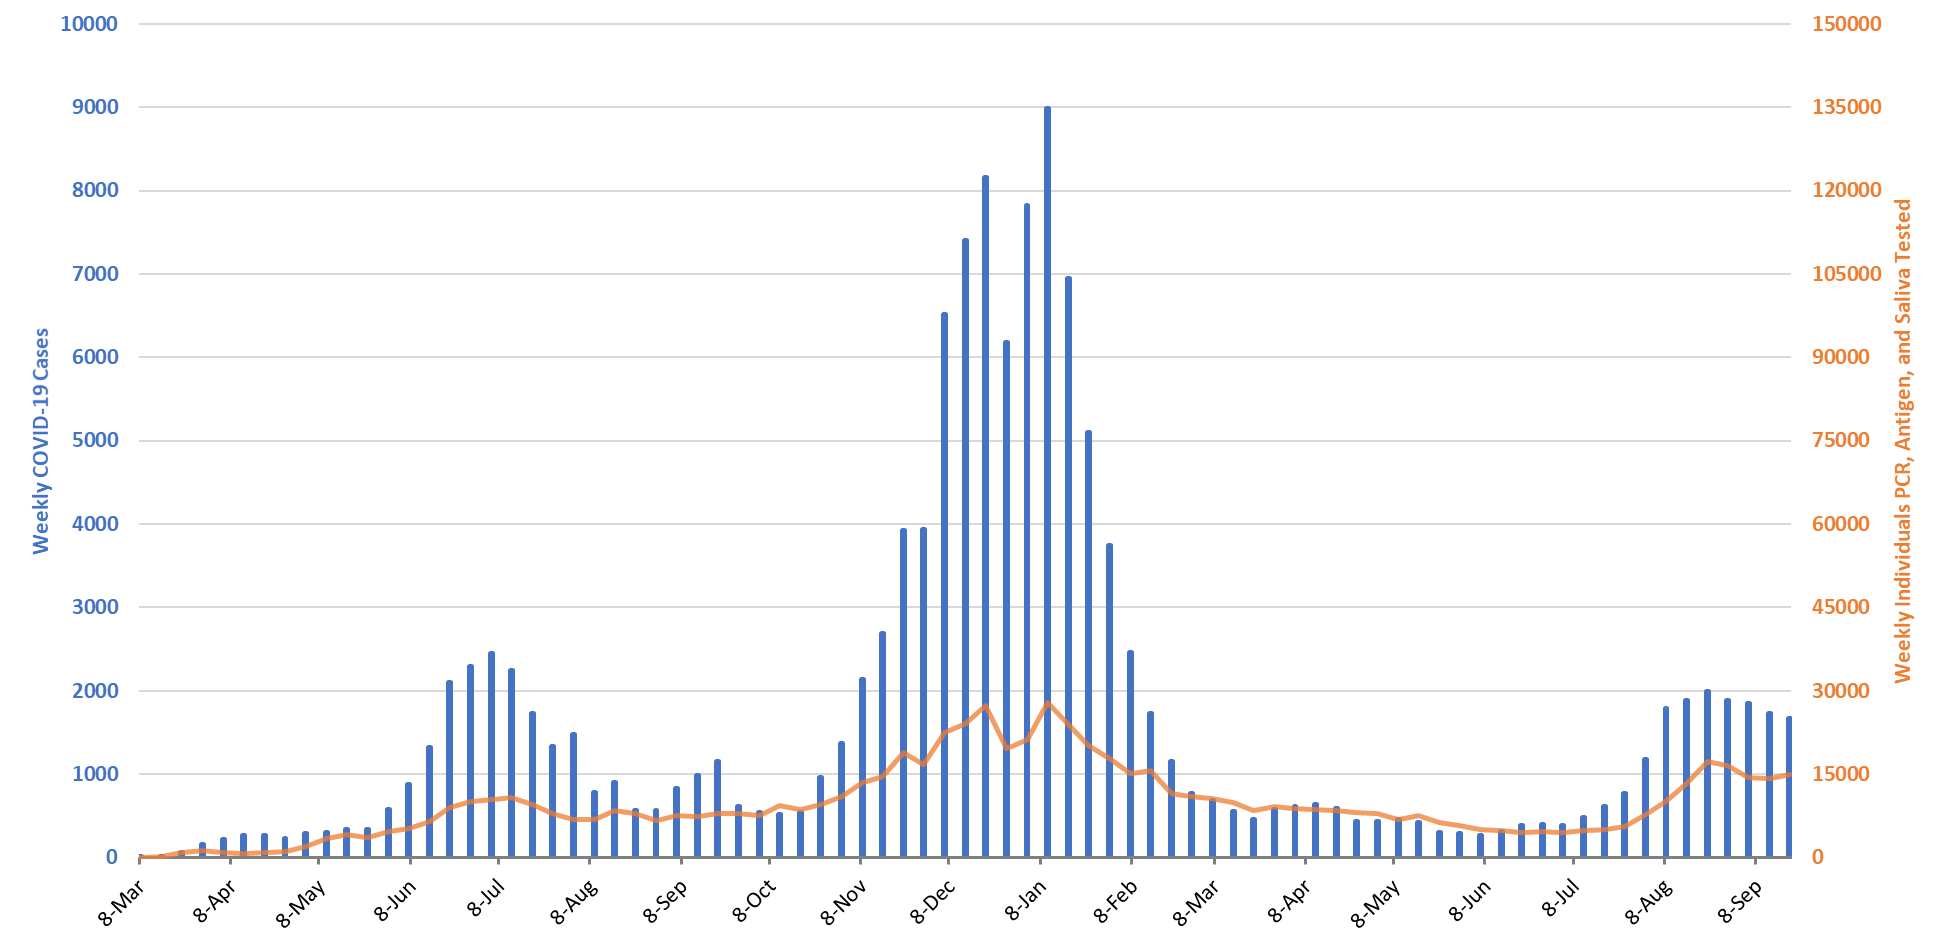
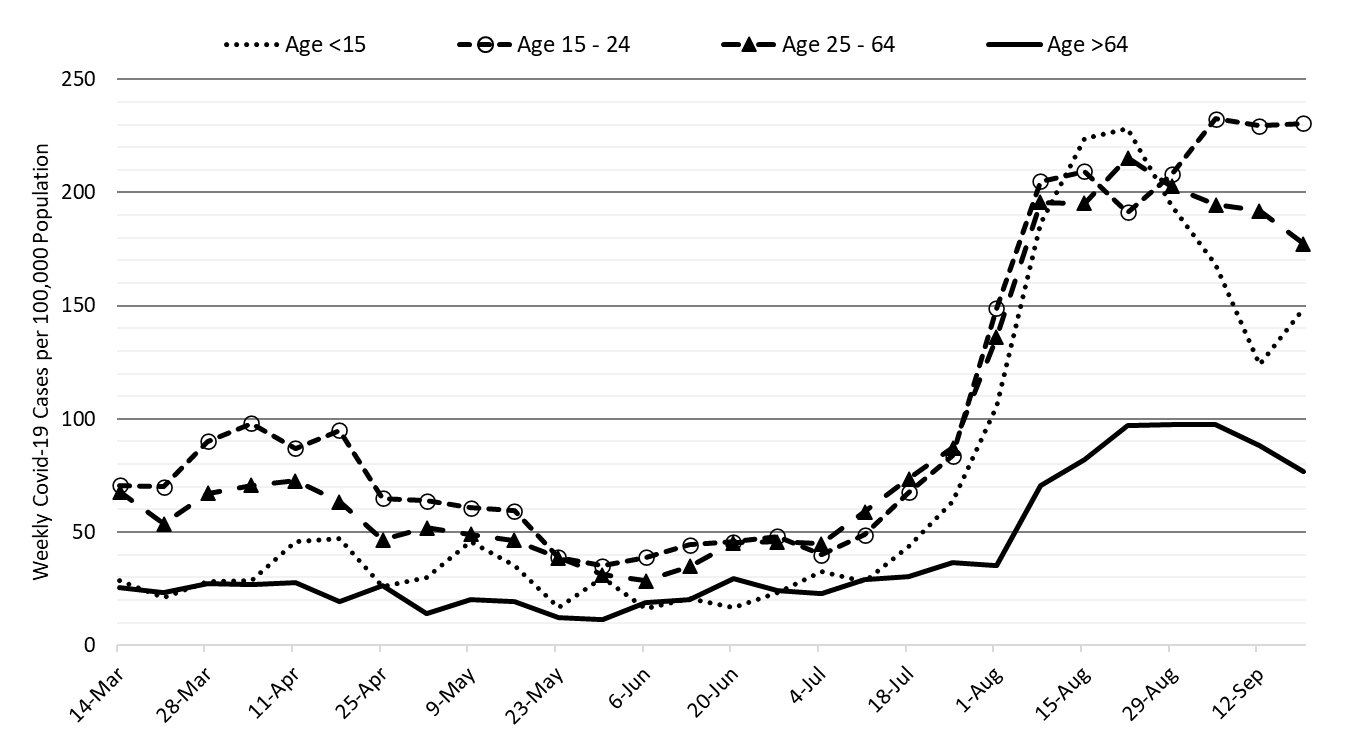
For the week ending September 19th, 16624 Arizonans were diagnosed with COVID-19, a 7% decrease from last week’s initial tally of 17813 cases (Figure 1). The current rate, 228 cases per 100K residents per week, is decreasing by 18 cases per 100K residents per week. Case rates remain highest among those 15 – 24 years and lowest among those >65 years, 302 versus 126 cases per 100K residents, respectively (Figure 2a bellow). Over the past 4 weeks, the largest improvements have been observed among children with rates declining 42% from their peak.
|
Figure 1. Weekly COVID-19 Cases in Arizona and Number of Individuals Undergoing COVID-19 Diagnostic Testing March 1, 2020 – September 19, 2021. |
While Arizona continues to experience a high number of cases, hospitalizations, and deaths, conditions are slowly improving except for a small number of counties like LaPaz, Navajo, Gila and Coconino Counties. Arizona’s national ranking holds at 32nd out of 50 states this week with the nation’s leaders being Alaska (855), West Virginia (662), Wyoming (641), Montana (609), and Kentucky (571).
According to the CDC, 61% of Arizona’s adult population is fully vaccinated and another 11% have received one dose. The ADHS Vaccine Dashboard shows weekly doses delivered are holding steady at 70K doses per week. Based on national serology data, the combination of natural and vaccine immunity likely exceeds 80% in most parts of the country and among most age groups. Nevertheless, non-pharmacologic interventions like mask mandates, limited gathering sizes, and targeted business mitigations will help speed resolution and ensure this wave does not reignite.
In another major development, the FDA advisory panel on vaccines recommended Pfizer booster for those 65+ years of age. The CDC Director, Dr. Rochelle Walensky, overruled her advisory board by adding those at high risk of occupational exposure (e.g., health care workers, teacher, etc.) to those with underlying medical conditions placing them at risk of severe illness.
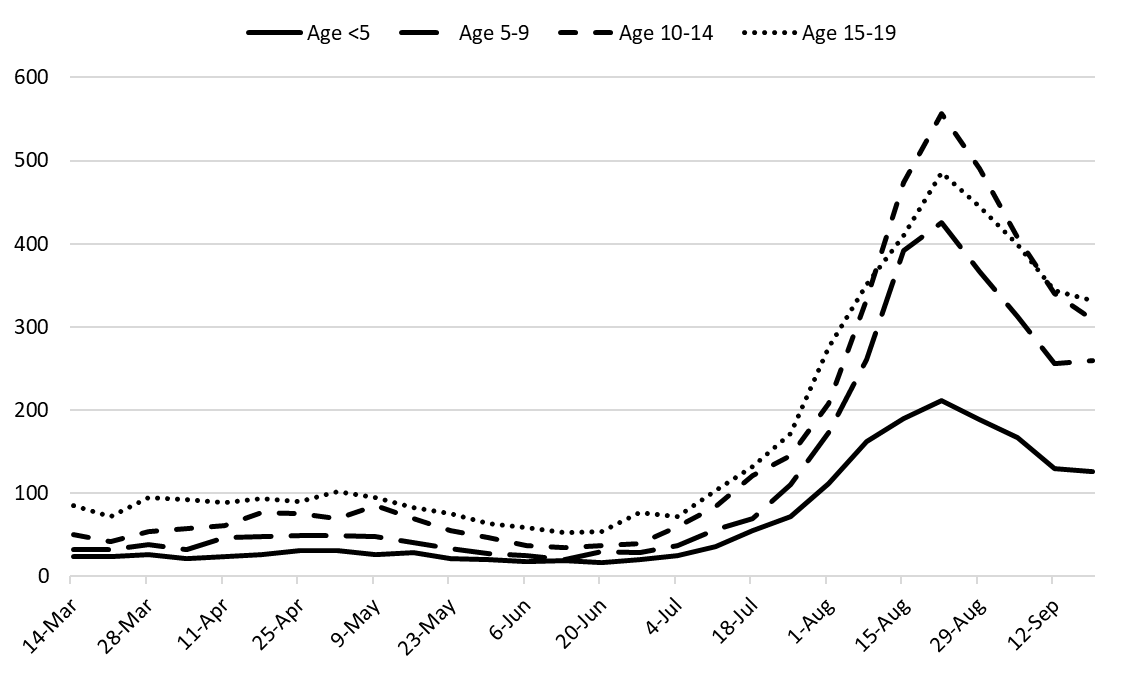
Figure 2a shows the sharp decline in transmission among children (dotted) slowing a bit this past week. The smallest gains are observed among the elderly (solid). We now have even stronger evidence supporting mask mandates in K – 12 schools. According to ASU, MCDPH, and PCHD researchers, Arizona schools without a mask mandate have 3.5 times the odds of having a school outbreak (95%CI 1.8 – 6.9). Clearly, mask mandates are helping to slow transmission among school-age children 5 – 19 years (Figure 2b). A judge presiding over the challenge to Arizona’s prohibition of school mask mandates intends to rule before the September 29th date the law will take effect.
|
Figure 2a. COVID-19 Cases in Arizona by Age Group March 7 – September 19, 2021. |
|
Figure 2b. COVID-19 Cases in Arizona among Children by Age Group March 7 – September 19, 2021. |
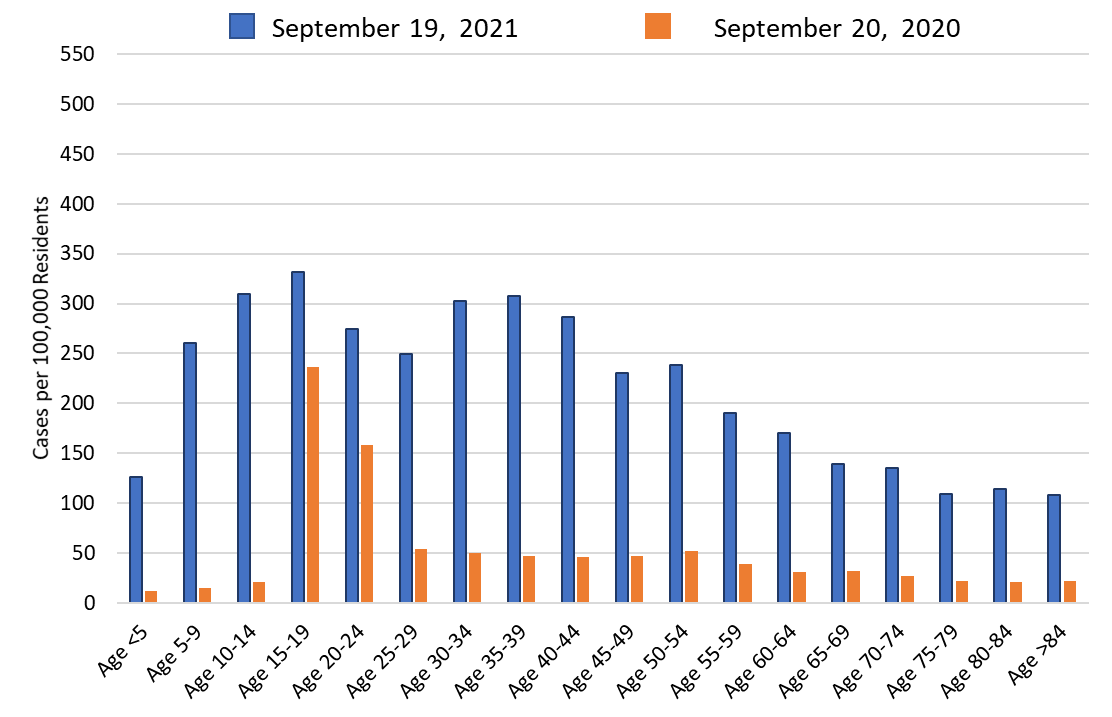
Comparing school reopening this year (in-person) with last year (virtual), levels of community transmission are much higher this year than last, particularly among those <15 years (Figure 2c). Higher transmission among those 15 – 24 years associated with university re-openings was ongoing this time last year (orange bars, ages 15 – 24). Transmission on campus is not an outlier this year which is consistent with the data reported on the UA COVID-19 Dashboard which indicates fewer reported cases on campus this year than last.
|
Figure 2c. COVID-19 Cases in Arizona by Age Group Week Ending September 20, 2020 versus September 19, 2021. |
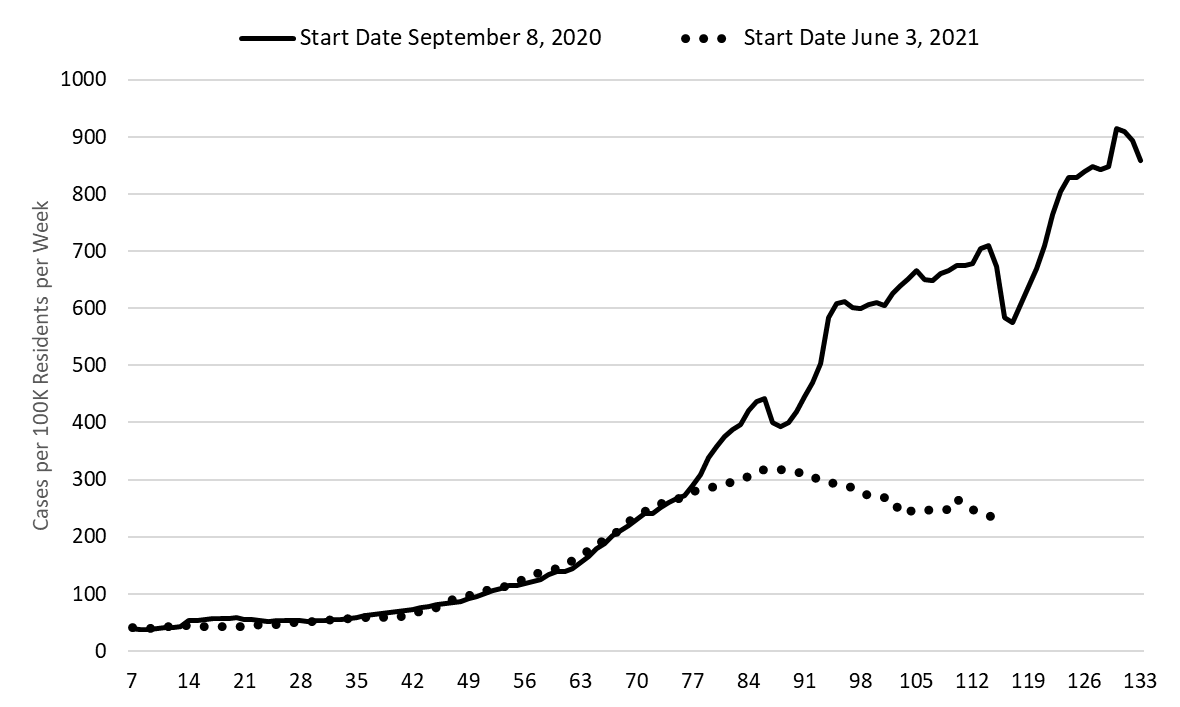
Over the past month, the trajectory of the current outbreak and that of the winter 2020/2021 outbreak have meaningfully diverged (Figure 2d). We are now experiencing a more permanent shift away from last year’s trajectory. Nevertheless, improvements from the peak are considerably slower this time than either of the last two peaks meaning the size (volume) of this wave could eventually exceed that of the summer 2020 wave.
|
Figure 2d. Fall 2020 and Fall 2021 COVID-19 Waves Superimposed (116 days). |
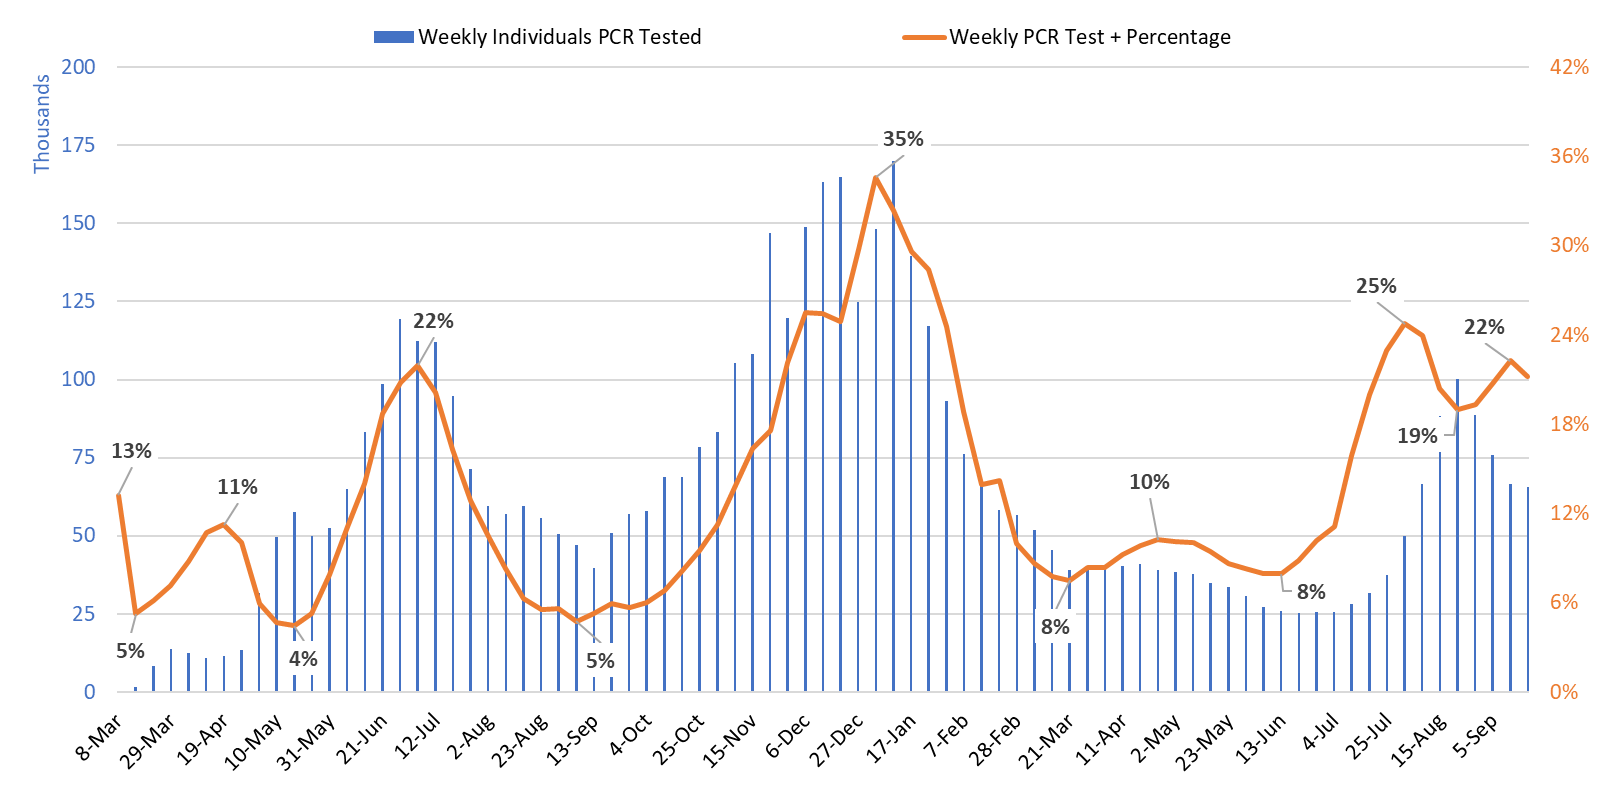
Test positivity among those undergoing traditional nasopharyngeal testing remains unexpectedly high at 21% (Figure 3). This level of positivity indicates that testing is woefully inadequate for public health practice and that many cases are going undiagnosed. It appears that the disruption in testing associated with Labor Day is passing.
|
Figure 3. Weekly Number of Patients Undergoing Traditional Nasopharyngeal PCR Testing and Associated Percent Positivity March 1, 2020 – September 19, 2021. |
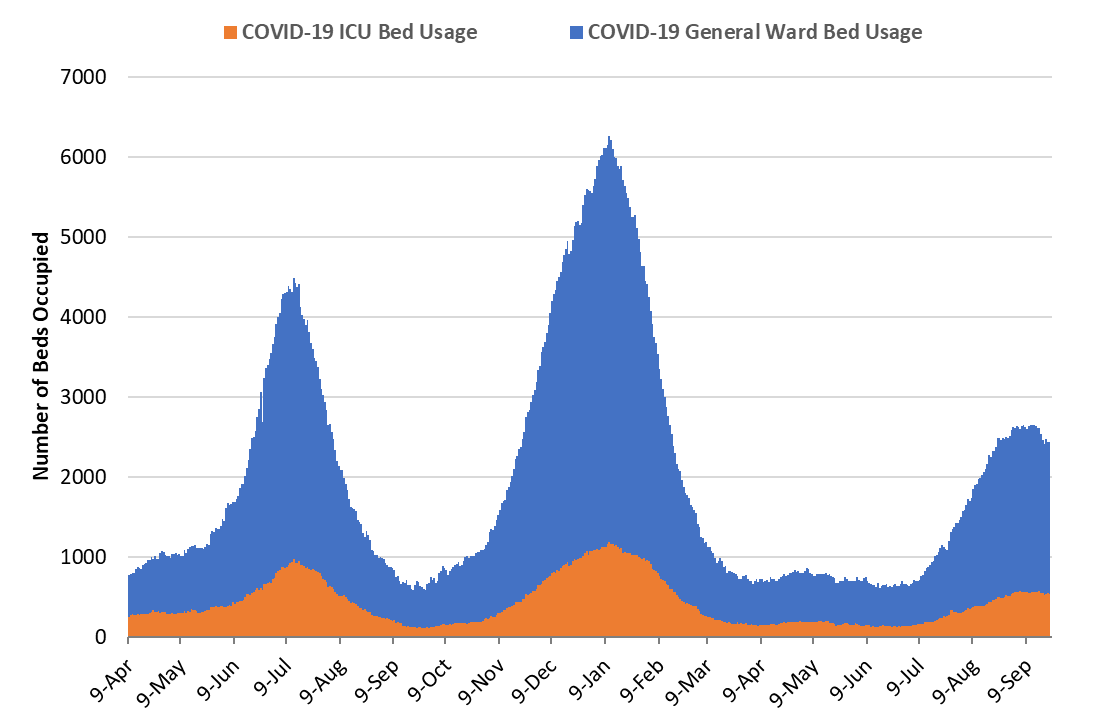
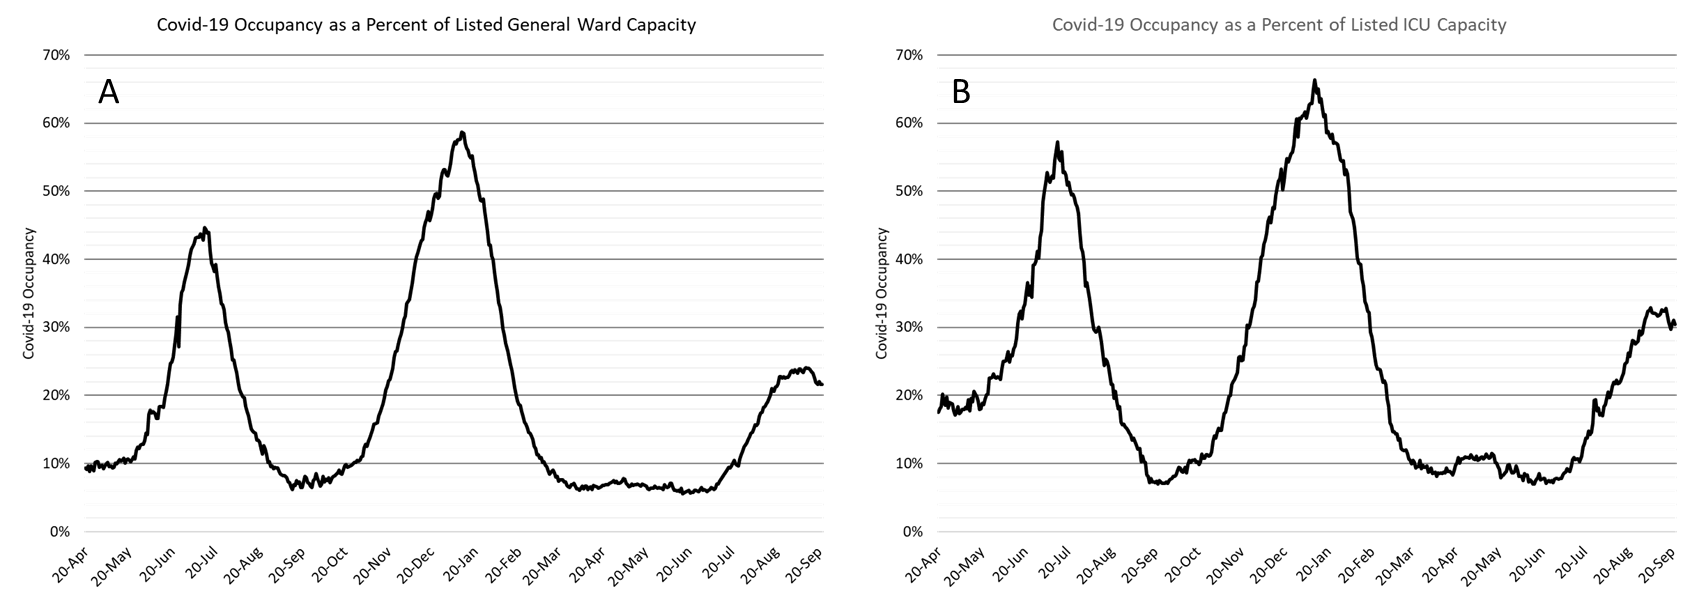
As of September 22nd, 1893 (22%) of Arizona’s 8773 general ward beds were occupied by COVID-19 patients, an 8% decrease from last week’s 2050 occupied beds (Figure 4 and Figure 5 Panel A). Another 683 (8%) beds remained available for use. The number of available beds is fewer than last week’s 695 beds.
|
Figure 4. Arizona Daily COVID-19 General Ward and ICU Census April 9, 2020 – September 22, 2021. |
As of September 22nd, 539 (30%) of Arizona’s 1772 ICU beds were occupied by COVID-19 patients, a 5% decrease from last week’s 565 occupied beds (Figure 4 and Figure 5 Panel B). An additional 132 (7%) ICU beds remained available for use, fewer than last week’s 143 beds.
As a lagging indicator, hospital COVID-19 occupancy is now declining as expected in the general ward and ICU.
|
Figure 5. COVID-19 Occupancy as a Percent of Listed General Ward (A, left) and ICU (B, right) Capacity in Arizona April 20, 2020 – September 22, 2021. |
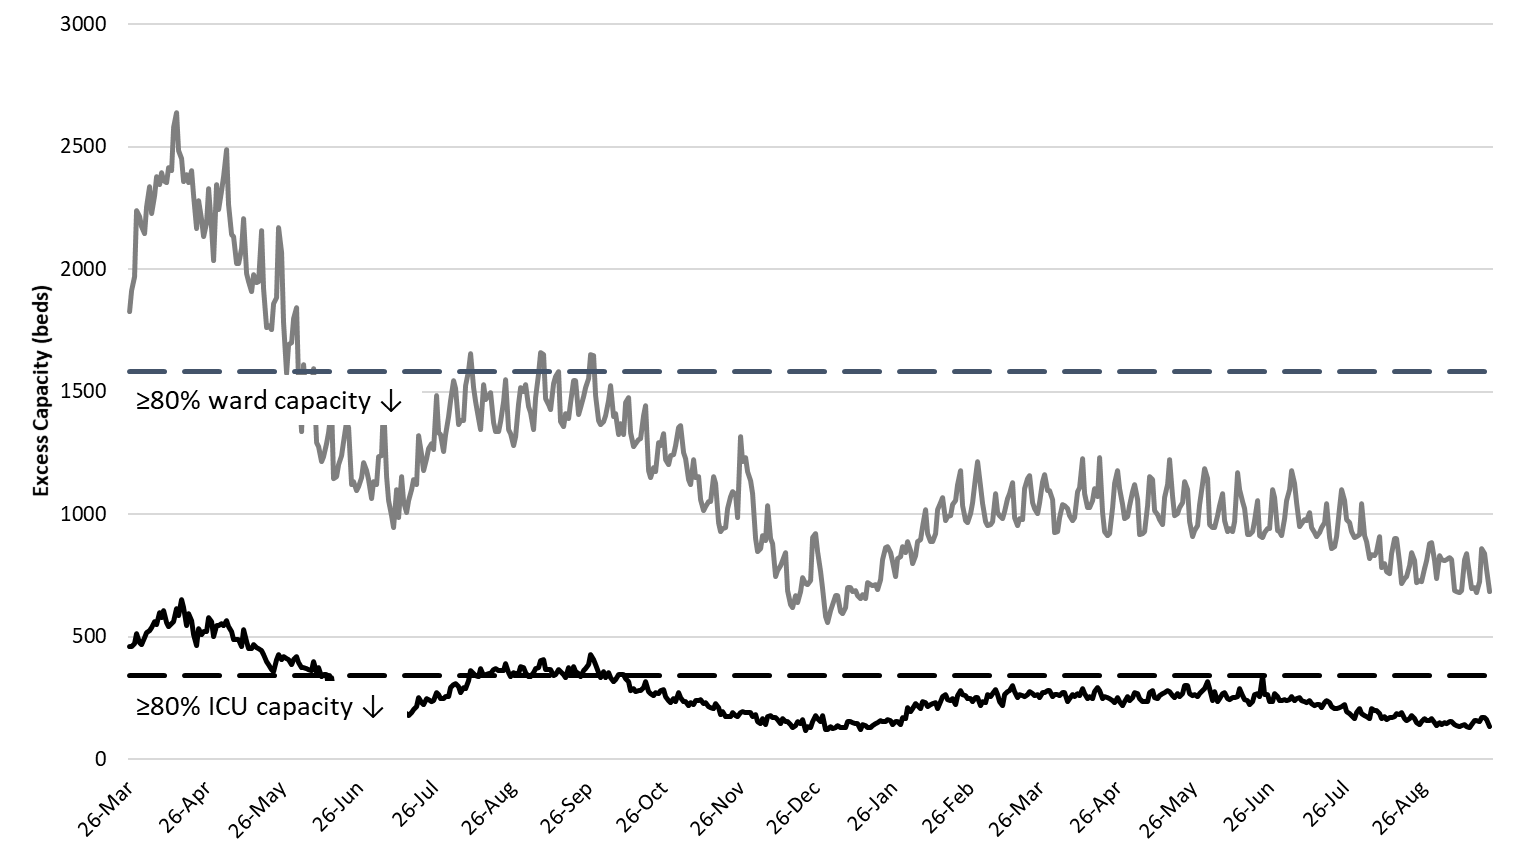
Arizona hospital occupancy remains above seasonal levels. Safety margins, as measured by excess available beds, remain quite low (Figure 6). Available excess capacity is nearly as low as it was at the worst of the winter 2020/2021 surge. Because occupancy is not improving in response to declining community transmission, hospitals should be prepared for >20% ward occupancy and >25% ICU occupancy for another week or two. Even if you are vaccinated, the tail of this COVID-19 surge will still impact your access to healthcare services should you become ill.
|
Figure 6. Observed Excess Non-Surge General Ward and ICU Capacity in Arizona March 26, 2020 – Sept 22, 2021. |
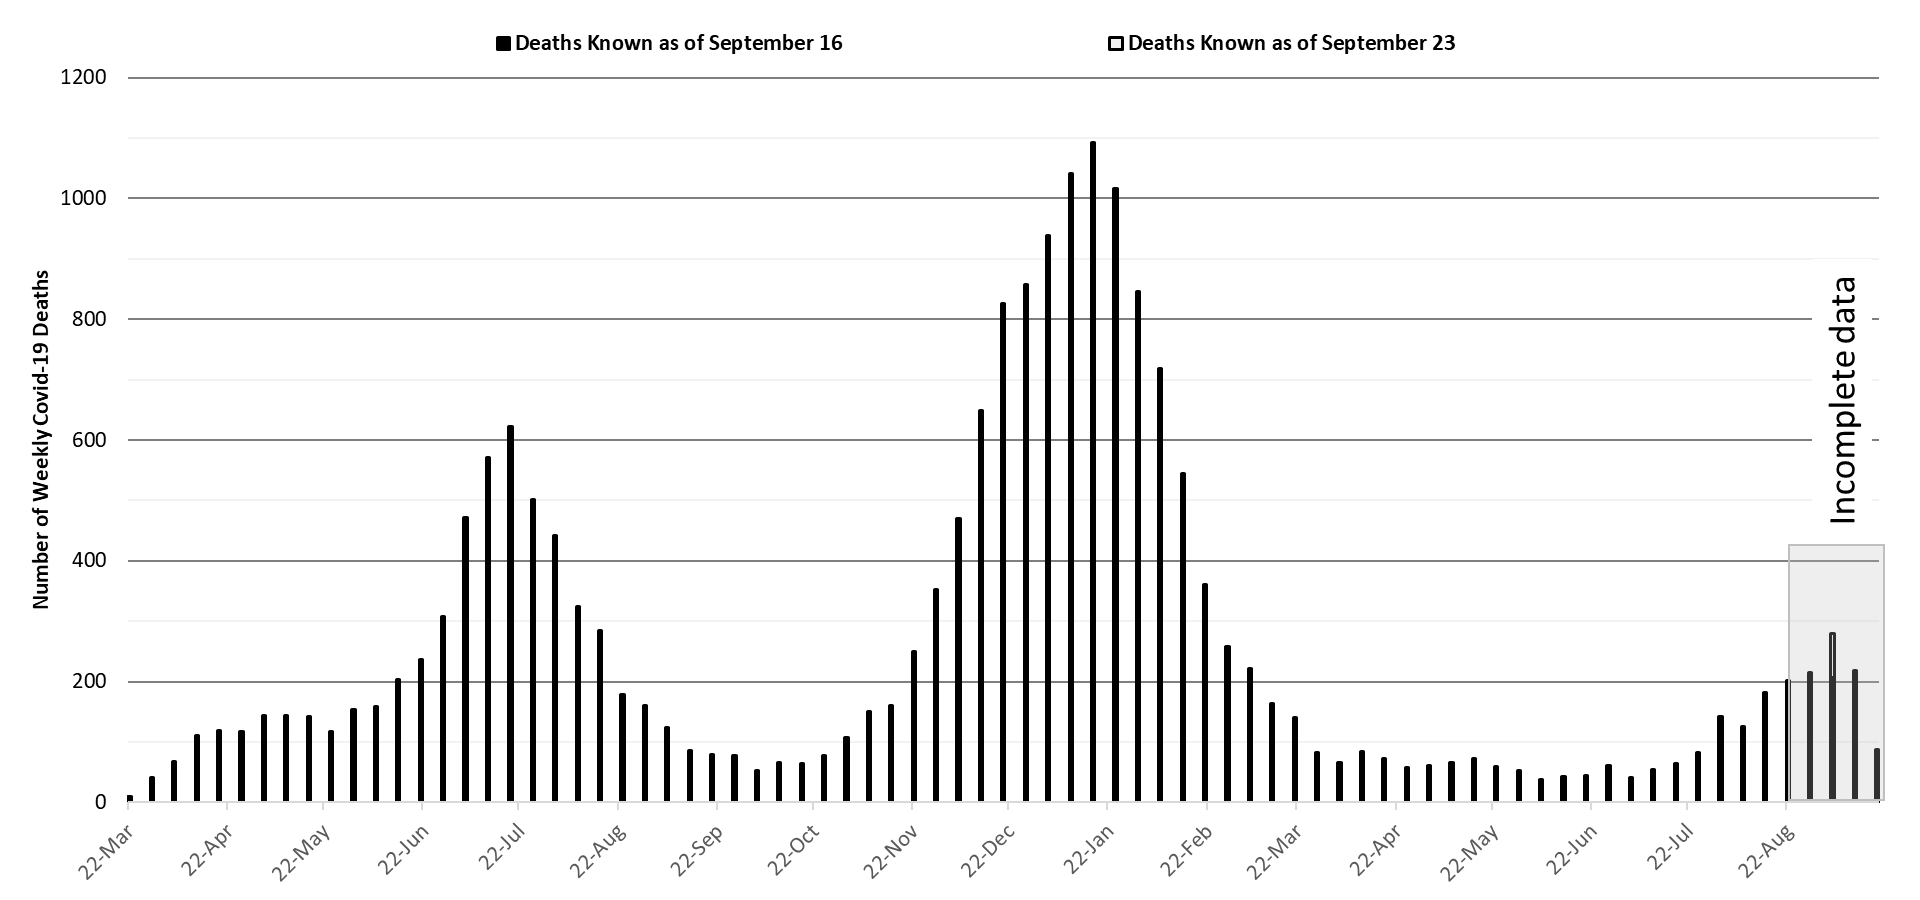
Arizona has experienced >200 COVID-19 deaths per week the past 3 weeks (Figure 7). The week ending September 5th has so far recorded 280 deaths with the week ending September 12th close behind with 218 recorded deaths. In a sobering reversal, it now almost certain that Arizona will reach 300 deaths per week for the weeks ending September 5th and/or the week ending September 12th with declines following soon thereafter.
|
Figure 7. Weekly Arizona COVID-19 Deaths March 16, 2020 – September 19, 2021. |
Pima County Outlook
For the week ending September 19th, 1678 Pima County residents were diagnosed with COVID-19 a 2% decline from last week’s initial tally (Figure 8). This marks the 4th week of declining case counts although the decline is more modest than the state trend.
|
Figure 8. Weekly COVID-19 Cases in Pima County and Number of Individuals Undergoing COVID-19 Diagnostic Testing March 1, 2020 – September 19, 2021. |
New cases are being diagnosed at a rate of 160 cases per 100K residents per week and is declining by 5 cases per 100K residents per week. Trends across the various age groups appear in Figure 9.
|
Figure 9. COVID-19 Cases in Pima County by Age Group March 7, 2020 – September 19, 2021. |
Summary
- Arizona continues to experience high levels of community transmission, but case rates are slowly declining. Test positivity remains stubbornly high reminding us that test capacity, accessibility, and/or uptake is woefully inadequate to meet public health needs. Slow improvements, particularly among older groups, serves as a warning that major behavioral shifts could result in future increases.
- As of September 19th, new cases were being diagnosed at a rate of 228 cases per 100K residents per week. The rate was decreasing by 18 cases per 100K residents per week.
- A shout out to Yuma County, the first county to fall below the threshold of high transmission (>100 cases per 100K residents per week). Yuma County is at 96 cases per 100K residents and is declining briskly at 45 cases per 100K per week. Good job Yuma!!
- Despite the NAU win over UA last weekend, Pima County is solidly ahead of Coconino County in the race to substantial transmission. Coconino County is experiencing 275 cases per 100K per week, increasing by 40 cases per week, while Pima County is experiencing 160 cases per 100K per week, decreasing by 5 cases per week. Bear Down!
- Importantly, schools may have to discontinue evidence-based mitigation practices (e.g., masking) on September 29th depending on an impending court ruling.
- New data from ASU, MCDPH, and PCHD confirm mask mandates in schools work! https://www.cdc.gov/mmwr/volumes/70/wr/mm7039e1.htm?s_cid=mm7039e1_w.
- Other data on school mask mandates from 500+ US counties also shows they work https://www.cdc.gov/mmwr/volumes/70/wr/mm7039e3.htm?s_cid=mm7039e3_x.
- Vaccination remains the most important public health priority to reduce viral spread and severe illness in the long run; however, mask mandates, restrictions on indoor gatherings, and targeted business mitigations are still needed to more quickly reduce transmission and prevent a reversal in the short-term.
- The FDA advisory panel on vaccines recently recommended Pfizer booster for those 65+ years of age and those at high risk https://www.cnn.com/2021/09/17/health/fda-advisers-booster-five-things/index.html.
- The CDC Director, Dr. Rochelle Walensky, overruled her advisory board by adding those at high risk of occupational exposure (e.g., health care workers, teacher, etc.) to those with underlying medical conditions placing them at risk of severe illness. https://www.cdc.gov/media/releases/2021/p0924-booster-recommendations-.html.
- A recent Lancet article lays out concerns some scientists have with widespread approval https://www.thelancet.com/journals/lancet/article/PIIS0140-6736(21)02046-8/fulltext. Criticism was also noted in the NY Times https://www.nytimes.com/2021/09/24/opinion/covid-booster-shots.html.
- COVID-19 hospital occupancy is holding steady and is likely to exceed 20% of all beds in the general ward and 25% of beds in the ICU for another week or two. Access to care will remain restricted even on the backside of waning COVID-19 case rates. Expect delays in elective procedures to persist.
- The improvement from the current peak seems slower than that of prior peak’s. If so, there is still the possibility that this wave might move into second place overall for the greatest burden of hospitalizations and deaths if conditions don’t improve faster.
- In a sobering reversal, weekly deaths now exceed 200 per week and will almost certainly reach 300 for the week ending September 5th and perhaps September 12th too before receding.
Forecast reports to date, available as PDFs
Download PDF to view additional charts of Arizona counties, available in appendix of report.
2020 Reports
Based on what we know now about this pandemic, we support guidelines for social distancing to slow the spread of the virus and urge everyone to follow the recommendations provided by the Centers for Disease Control and Prevention (CDC) to protect yourself, your family, your neighbors, and your employees. Please heed the recommendations as provided by the CDC.
COVID covid coronavirus virus covid19 corona forecast model

